By Stephanie Bryant-Erdmann, USW Market Analyst

Sharply lower U.S. wheat production pushed futures prices to 2-and 3-year highs earlier this summer. However, bearish factors have recently pushed prices down. And when wheat futures are under pressure, wheat importers have the opportunity to lock in competitive prices and maybe even find some bargains.

Chicago Board of Trade (CBOT) soft red winter (SRW) wheat futures and export basis are both under pressure from a growing 2017/18 (June to May) supply, which USDA estimated at 14.2 million metric tons (MMT). The year-to-date average SRW Gulf FOB value of $196 per metric ton (MT) is $50 below the 5-year average, and this is a very good quality new crop (for more information on 2017/18 SRW quality, read “Millers and Processors Should Like the 2017/18 Soft Red Winter Crop” below).

Though U.S. hard red winter (HRW) production is forecast to shrink 30 percent in 2017/18, year-to-date Kansas City Board of Trade (KCBT) HRW wheat futures average $58 per MT below the 5-year average. This is due mainly to KCBT contract specifications and lower average protein levels in the 2016/17 and 2017/18 crops. While HRW futures trickle lower, protein premiums continue to widen. Historically, Gulf HRW protein premiums ranged between $1.50 to $4.40 per MT for each additional 0.5 percent of protein. Pacific Northwest (PNW) HRW protein premiums normally average $2.95 to $7.35 per MT. In 2017/18, that range is now $11 to $32 per MT for the Gulf and $8 to $18 per MT for the PNW.

The widening protein premiums represent the tightening global supply of higher protein wheat. Yet FOB prices for 12 percent Gulf and PNW HRW are $40 and $41 per MT below the 5-year averages, respectively (all U.S. wheat protein is based on 12% moisture). Customers who can use lower protein HRW can take advantage of FOB prices for ordinary/unspecified protein HRW, which are $73 per MT below historic levels at the Gulf and $57 per MT below the 5-year average in the PNW.  Preliminary data shows 2017/18 HRW average protein is 11.5 percent, slightly above last year’s final of 11.2 percent, but below the 5-year average of 12.6 percent.

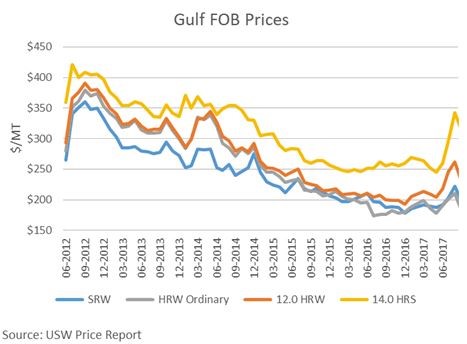
The Minneapolis Grain Exchange (MGEX) hard red spring (HRS) wheat futures have retreated from the 3-year highs reached earlier this summer. However, U.S. and Canadian spring wheat production estimates are supportive of current price levels. StatsCan expects Canadian wheat production (excluding durum) to fall 7 percent to 22.3 MMT. MGEX HRS futures are hovering near the August 5-year average of $6.79 per bushel ($249 per MT), but HRS export basis levels are $15 to $25 per MT below normal at both PNW and Gulf export locations. With harvest still underway in the U.S. Northern Plains and Canada, customers can mitigate some of their risk by locking in these competitive basis levels.

Export pricing for soft white (SW) wheat is not tied to a wheat futures market, but as noted in the July 27 Wheat Letter, protein premiums are shrinking for SW due to the excellent quality and more normal protein distributions in recent crops. PNW FOB export prices for 10.5 max protein SW are $62 per MT below the 5-year average, while FOB prices for 9.5 max protein SW are $70 per MT lower.

Well-informed customers can take advantage of these buying opportunities and lock in lower prices for high-quality U.S. wheat in the next few weeks. Your local USW representative is ready to help answer any questions about U.S. wheat pricing or the U.S. wheat marketing system. To track U.S. wheat nearby prices, review and/or subscribe to the USW Price Report here.

thumbnail

USDA forecast U.S. 2017/18 wheat production at 47.9 million metric tons (MMT), down 24 percent year over year and 18 percent below the 5-year average. The reason: an anticipated 12 percent decline in average yield and the lowest planted acres since USDA records began in 1919. However, USDA expects 2017/18 U.S. beginning stocks to total 32.2 MMT, up 21 percent year over year and the most since 1988/89. As a result, total 2017/18 U.S. wheat supply is forecast at 80.1 MMT, down 10 percent from 2016/17 but still 1 percent above the 5-year average of 79.3 MMT. USDA expects average yield to be 46.2 bu/acre (3.10 MT/ha), which is close to the 5-year average of 46.6 bu/acre (3.13 MT/ha).

On June 30, USDA estimated total planted wheat area would fall 9 percent year over year to 45.7 million acres (18.5 million hectares). If realized, that would be 17 percent lower than the 5-year average. USDA expects 2017/18 harvested area to drop 13 percent from last year and 18 percent below the 5-year average to 38.1 million acres (15.4 million hectares).

USDA forecast 2017/18 hard red winter (HRW) production to total 20.6 MMT, down 30 percent from 2016/17 and 14 percent below the 5-year average. A smaller planted area and sharply lower harvested area led to the decline. U.S. farmers planted 23.8 million acres (9.63 million hectares) of HRW for 2017/18, down 10 percent from 2016. Due to weather and wheat streak mosaic virus, harvested area in top HRW-producers Texas, Oklahoma and Kansas is projected to fall 16 percent year over year. USDA forecast 2017/18 HRW beginning stocks at 16.1 MMT, up 33 percent year over year and 81 percent above the 5-year average. Total 2017/18 HRW supply is expected to total 36.8 MMT, down 12 percent from 2016/17.

Soft red winter (SRW) production is also expected to decline 11 percent to 8.33 MMT in 2017/18 due to fewer planted acres. USDA estimated total 2017/18 SRW area at 5.61 million acres (2.27 million hectares), 15 percent lower than 2016/17 and 30 percent below the 5-year average. In contrast to recent years, SRW harvest in the U.S. Southern Plains is progressing rapidly with good harvest conditions. On July 7, the USW Weekly Harvest report showed the average grade on 199 samples was U.S. #2 in a generally sound crop with DON levels that are significantly below the 5-year average. USDA estimates that SRW 2017/18 beginning stocks totaled 5.85 MMT, up 37 percent from 2016/17 and 47 percent above the 5-year average. The larger beginning stocks will offset reduced production, and total 2017/18 SRW supply is expected to increase by 500,000 MT year over year to 14.2 MMT.

USDA reported white wheat production will decrease 11 percent from 2016/17 to 6.91 MMT, but still 1 percent above the 5-year average, if realized. The decline is due to 3 percent fewer planted acres and slightly lower forecast yields. Idaho, Oregon and Washington have received ample moisture and winter wheat conditions there average 78 percent good to excellent. USDA estimates soft white (SW) beginning stocks increased 42 percent year over year to 2.86 MMT. The larger beginning stocks are expected to offset the lower production, leaving the 2017/18 SW supply unchanged year over year at 9.77 MMT.

Hard red spring (HRS) production is expected to plummet in 2017/18 to 10.5 MMT, down 22 percent from the prior year and the lowest since 2002/03, if realized. The average spring wheat yield is forecast at 40.3 bu/acre (2.73 MT/ha), down 15 percent from 2016/17. USDA also estimates farmers planted 10.3 million acres (4.17 million hectares) to HRS, 10 percent below 2016/17 levels. As of July 11, 55 percent of North Dakota is in a severe or extreme drought and the remainder of the state is abnormally dry or in a moderate drought. Similarly, 72 percent of South Dakota and 45 percent of Montana are in a moderate to extreme drought. As of July 10, just 35 percent of the spring crop was rated good or excellent and 39 percent was poor or very poor. In North Dakota, the largest HRS producing state, 36 percent of the crop is in good or excellent condition. USDA anticipates 2017/18 HRS beginning stocks of 6.39 MMT are 14 percent less than last year. Estimated 2017/18 HRS supply will total 16.9 MMT, down 19 percent year over year. USDA expects the HRS stocks-to-use ratio to fall to 22 percent in 2017/18, compared to 41 percent one year prior.

Smaller planted area and 30 percent lower yields are expected to reduce durum production to 1.55 MMT in 2017/18, down an estimated 45 percent from 2016/17 and 26 percent below the 5-year average. USDA expects average durum yields to sink to 30.9 bu/acre (2.08 MT/ha), compared to 44.0 bu/acre (2.96 bu/acre) in 2016/17. Durum planted area decreased this year as farmers responded to lower prices and large carry-out stocks. Spring-planted northern durum is grown primarily in North Dakota and Montana, and the Desert Durum® harvest in Arizona and California is nearly complete. USDA estimates 2017/18 durum beginning stocks at 980,000 MT, up 29 percent from the prior year and 45 percent greater than the 5-year average. Increased beginning stocks will not offset the drastically reduced 2017/18 production so USDA expects the U.S. durum supply will fall to 2.53 MMT, 29 percent below 2016/17 levels and 9 percent below the 5-year average. The U.S. durum stocks-to-use ratio will fall to 24 percent, on par with the 5-year average.

Even with reduced production for 2017/18, U.S. farmers stored significant amounts of grain last year, ensuring that customers can continue purchasing reliable, high-quality wheat. Customers are encouraged to contact their local USW representative to discuss purchasing strategies in this volatile global wheat market.

thumbnail

By Elizabeth Westendorf, USW Policy Specialist

John Hoffman farms some of the same land that four generations of his family have managed since the late 1800s. Today, the farm covers roughly 3,200 acres where he grows corn, soybeans and soft red winter (SRW) wheat. For Hoffman, sustainability is key to preserving his family’s farming tradition for the next generation.

“I think we’re sustainable when every year we are able to plant a crop, harvest a crop, and do it again the next year,” said Hoffman. “If we are not sustainable, that would not happen — we would not stay in business every year.”

Hoffman believes being sustainable means being an early adapter of emerging practices on his farm. He tries to embrace the latest farming technologies to help improve his business, such as no-till and minimum till practices to improve soil health, GPS technology to increase accuracy and use inputs efficiently, and government conservation programs to give back to the environment.

Hoffman is the fourth of six U.S. wheat farmers featured in a USW series on wheat sustainability. These profiles show the differences in wheat production practices across the country and how those farming practices enhance the sustainability of U.S. agriculture.

“Family farming is a way of life, but it is also a large business,” said Hoffman. “Anything we can do to improve on what we do as business people, farmers and human beings to make things better, we are going to attempt to do it.”

A good example is how Hoffman uses a combination of no-till and minimum-till practices depending on crop need. No-till farming does not disturb the soil, which increases the amount of water that penetrates the soil surface and improves organic matter. Minimum-till helps warm the soil or reduce excess moisture. Both techniques reduce erosion compared to traditional tillage. He produces all his wheat and 80 percent of his soybeans with no-till technology, and he uses minimum tillage in corn production.

Access to better seed over the years has allowed Hoffman to improve his farming practices and use innovative techniques so that his farm is constantly improving. This story is true for many farmers, as plant breeding comes up with new varieties that respond to specific agronomic and economic challenges. That innovation is just another facet of the sustainability story.

“With the new genetics available in seed today, we can be more cost-effective and utilize less chemicals. That also made the no-till option a lot more practical,” said Hoffman. “Plus, the soil savings — the conservation aspect of it — we thought it was better for our land. It really helped reduce soil erosion.”

Another issue in Hoffman’s area is how farming affects water quality. By reducing soil erosion, he and other farmers reduce the amount of water that runs off their fields. Hoffman has also tried to reduce his inputs over the years to help with water quality and makes sure to use them intelligently — by not applying fertilizer on frozen ground or before a large rain, he makes sure that those inputs stay in the field instead of being washed away. On some of his land, he has been able to use government conservation programs and plant grass around the natural water runoff areas.

Hoffman’s farm has thrived because he has been able to innovate and adopt new technologies and practices over the years. At its core, that is what sustainability is about — constant improvement. Each of the farmers featured in USW’s Sustainability Profiles embody this idea. They do it in different ways, but with that one idea in common.

Learn more about Hoffman and his farm at www.uswheat.org/factsheets. U.S. farmers, ranchers, fishermen and foresters also share their values, sustainability experiences and conservation practices at the U.S. Sustainability Alliance.

Harvest Report

By Stephanie Bryant-Erdmann, USW Market Analyst

Combines are beginning to roll for winter wheat harvest in the United States with highly variable wheat and field conditions. The U.S. National Weather Service reported that in May much of the U.S. Plains region received 1.5 to 3 times more rain than normal. On Tuesday, May 30, USDA rated 50 percent of the winter wheat crop in good to excellent condition, down 2 percentage points from the prior week; 15 percent of the crop was rated in poor or very poor condition. The following is a summary of harvest progress, crop conditions, field conditions and planted area by state.

Colorado. Growing conditions across Colorado have been highly variable this year with some parts of the state experiencing very favorable conditions and others quite the opposite. The late April snowstorm dumped snow across eastern Colorado, albeit on less mature wheat. Parts of the state have also been hit by severe storms and hail in the last two weeks, with damage still being assessed. Farmers noted crop development is 7 to 10 days ahead of normal across the state. On May 30, USDA rated 50 percent of Colorado winter wheat in good to excellent condition compared to 43 percent the prior week; 16 percent of the crop is in poor or very poor condition. USDA reported 70 percent of Colorado wheat is headed, behind the 5-year average of 61 percent. Colorado farmers planted 891,000 hectares (2.20 million acres) of wheat last fall, down 6 percent from 2015. USDA expects winter wheat production to fall to 1.96 million metric tons (MMT), or 72.1 million bushels, down an estimated 31 percent from the prior year.

Kansas. Kansas Wheat CEO Justin Gilpin reports that the extent of damage from the May snowstorm that dropped as much as 22 inches (54 cm) of snow on western Kansas will depend largely on planting date, maturity and varieties. Since that storm, Kansas has continued to receive excessive rain leading to standing water in fields and increased disease pressure. On May 30, USDA rated 45 percent of winter wheat as good to excellent compared to 47 percent the prior week; 25 percent of Kansas wheat is rated poor or very poor. Kansas wheat is 97 percent headed, ahead of the 5-year average of 93 percent. Last fall, Kansas planted 3.00 million hectares (7.40 million acres), down 13 percent year over year and the lowest planted area in 60 years. USDA expects Kansas to produce 7.89 MMT (290 million bushels) in 2017/18, down 38 percent from last year.

Montana. Montana farmers noted good stands of wheat, but soil moisture conditions are variable across the state. USDA rated topsoil moisture supplies at 34 percent short or very short, 62 percent adequate and 4 percent surplus, compared to 17 percent short or very short, 72 percent adequate and 11 percent surplus last year on the same date. On May 30, USDA rated 48 percent of Montana winter wheat in good to excellent condition compared to 52 percent the week prior. Montana wheat has not yet started to head, which is behind the 5-year average pace of 5 percent headed. Farmers planted 770,000 hectares (1.90 million acres) of wheat in 2016, down 16 percent from 2015 due to wet field conditions and strong price competition from peas and lentils. USDA expects Montana to produce 2.22 MMT (81.6 million bushels), down 23 percent from 2016/17.

Nebraska. Farmers report that a cool, wet spring is increasing disease pressure across the state. They also noted abandonment of some fields after a late spring freeze badly hurt yield potential. USDA rated 47 percent of Nebraska winter wheat in good to excellent condition on May 30, up slightly from the prior week. Winter wheat is 86 percent headed, compared to the 5-year average of 55 percent on the same date. Nebraska farmers planted 441,000 hectares (1.09 million acres) of wheat in 2016, down 20 percent from 2015 and the lowest planted area on record for Nebraska. USDA expects Nebraska winter wheat production to total 1.4 MMT (51.5 million bushels), down an estimated 27 percent from the prior year.

Oklahoma. Harvest is underway in Oklahoma, though storms are causing some delays. Many of the recent storms included damaging hail and farmers are concerned about getting the wheat safely into the bin. USDA rated 45 percent of Oklahoma winter wheat in good to excellent condition on May 30, compared to 49 percent the week prior; 14 percent of the crop is in poor or very poor condition. USDA reported wheat harvest in Oklahoma is 3 percent complete, behind the 5-year average of 10 percent complete on the same date. Oklahoma farmers planted 1.82 million hectares (4.50 million acres) of wheat in 2016, down 10 percent from the year prior because late-season rain prevented some wheat planting. USDA expects Oklahoma winter wheat production to fall to 2.42 MMT (89.1 million bushels), down 35 percent year over year.

South Dakota. Temperatures fell below freezing last week in South Dakota, though the damage has not yet been assessed. Topsoil moisture is rated as 56 percent adequate, compared to 82 percent adequate last year, with subsoil moisture rated as 39 percent short to very short and 58 percent adequate. USDA rated 50 percent of South Dakota winter wheat in good to excellent condition compared to 54 percent last week; 20 percent of South Dakota winter wheat is in poor or very poor condition. Winter wheat is 32 percent headed in the state, on par with the 5-year average. South Dakota farmers planted 364,000 hectares (900,000 acres) of winter wheat, down 24 percent year over year. USDA expects South Dakota winter wheat production to decline to 1.19 MMT (43.7 million bushels), down 32 percent year over year.

Texas. Harvest started two to three weeks ahead of average in Texas and, as in Oklahoma, severe storms and hail threaten the crop. As of May 30, harvest is 22 percent complete, ahead of the 5-year average of 15 percent complete. Last fall, Texas farmers planted 1.82 million hectares (4.50 million acres) of wheat, down 10 percent from the year prior in very dry field conditions. In the past two years, Texas planted wheat area has dropped by 20 percent. USDA expects Texas wheat production to total 1.88 MMT (69.0 million bushels), down 23 percent from 2016/17. On May 30, USDA rated 31 percent of Texas winter wheat in good to excellent condition compared to 36 percent the week prior; 17 percent of the Texas crop is in poor or very poor condition.

Soft Red Winter (SRW) Conditions. Harvest is underway in the mid-South (13 percent of SRW wheat has been harvested in Arkansas). Crop conditions are generally good. However, recent rainy, cool conditions from the mid-South through the Midwest, Mid-Atlantic and Southeast have slowed maturity. In Ohio, Extension workers reported that the crop would benefit from drier and warmer weather. A poor price outlook compared to alternate crops has SRW planted area on a steady decline. USDA calculates SRW planted area at 2.24 million hectares (5.53 million acres) for 2017/18.

To track harvest progress, subscribe to the USW Weekly Harvest report.

To read the latest USW Weekly Harvest report, click here.

thumbnail

By Elizabeth Westendorf, USW Policy Specialist

In 2016, Field to Market published its third National Indicators Report that assessed sustainability metrics in U.S. agriculture and looked at production of each crop on a national scale. Based on its environmental indicators, the report showed that wheat production has continued to improve, with particular progress in reducing soil erosion, over the past 25 years. The assessment results reflect yield improvements in wheat and demonstrate how farmers have adopted conservation practices. Reports like this help quantify sustainability and production improvement over time.

Assessing wheat sustainability on a national scale is difficult, however, because of the highly regional nature of its production. There are six U.S. wheat classes, grown in distinct regions and local micro-climates. Aggregate measures of sustainability are important, but they fail to capture the nuances of a crop that is grown across many different climates, soil types and farm environments.

To capture some of those nuances, USW has developed a series of farmer profiles that highlight regional sustainability in U.S. wheat production. Featuring farmers that grow a specific U.S. wheat class, the profiles highlight their practices, dedication to sustainability and unique growing conditions. They illustrate that while no two farmers are the same, they share a dedication to protecting their land for the next generation and a commitment to responsible stewardship.

The profiles include:

We encourage our customers and stakeholders to read the profiles at www.uswheat.org/factsheets. There is also more information about how U.S. farmers, ranchers, fishermen and foresters share their values, sustainability experiences and conservation practices online at The U.S. Sustainability Alliance.

thumbnail

By Stephanie Bryant-Erdmann, USW Market Analyst

Over the past decade, U.S. wheat planted area peaked in 2008/09 at 63.2 million acres (25.6 million hectares). Since then, U.S. wheat planted area has fallen 27 percent to a projected 46.1 million acres (18.7 million hectares) in 2017/18 according to the March 31 USDA Prospective Plantings report. If realized, it will be 16 percent below the 5-year average of 55.0 million acres (22.3 million hectares) — making it the lowest planted wheat area since 1919 when USDA records began.

This report actually increased winter wheat planted area by 360,000 acres (146,000 hectares) from USDA’s January 2017 estimate to 32.7 million acres (13.23 million hectares). However, the new estimate is still 9 percent down from 2016/17 planted area. The increase came from hard red winter (HRW) area, estimated at 23.8 million acres (9.63 million hectares), up 2 percent from the previous projection. Still, HRW planted area will be down 10 percent from 26.5 million acres (10.7 million hectares) planted for 2016/17.

Soft red winter (SRW) planted area decreased from the previous estimate to 5.53 million acres (2.24 million hectares). The biggest declines occurred in Midwest states where SRW faces strong competition for acres from corn and, particularly this year, from soybeans.

USDA expects white wheat acres — planted in both winter and spring — to reach 4.12 million acres (1.67 million hectares) for 2017/18, down slightly from 2016/17, but in line with the 5-year average. For the first time in three years, the Drought Monitor shows adequate soil moisture in the Pacific Northwest (PNW) following a rather wet winter.

Given the drop in planted area, crop conditions become crucial to any look out at potential production for 2017/18. For HRW, the April 6 Drought Monitor also shows that 45 percent of Kansas and 66 percent of Oklahoma were abnormally dry or experiencing moderate drought, even though the region received 1 to 4 inches (2.5 to 10 cm) of rain last week. Fifteen percent of Oklahoma remains in severe or extreme drought. In 2016, these states grew nearly half of the total U.S. HRW crop.

Last week’s beneficial moisture improved U.S. winter wheat condition in Kansas, Oklahoma and Texas, but the crop is still in worse condition than last year at this time. As of April 3, USDA rated the winter wheat crop at 51 percent good to excellent, compared to 59 percent on the same date in 2016. USDA rated 14 percent of the crop as poor or very poor, up from 7 percent last year.

The U.S. Northern Plains received abundant precipitation this winter, providing good soil moisture for HRS and durum planting. The past two years, farmers in North Dakota, Montana and Minnesota began HRS planting 7 to 14 days ahead of normal due to early springs. This year, planting dates will be closer to normal as farmers are now waiting for fields to dry out.

According to USDA, U.S. total spring-planted area will decline to an estimated 11.3 million acres (4.57 million hectares), 3 percent less than in 2016/17. The estimate includes 10.6 million acres (4.3 million hectares) of hard red spring (HRS), down 7 percent from 2016, if realized.

USDA expects U.S. durum planted area to total 2.00 million acres (809,000 hectares), down 17 percent from 2016/17. If realized, this would further constrict the global durum supply discussed in the March 23 Wheat Letter.

Continuing to drive the decline in U.S. wheat planted area is a net farmer return on wheat that dropped 18 percent between 2015/16 and 2016/17, while input costs declined only one percent in the same time period. USDA expects this trend to continue in 2017/18, with returns falling another 6 percent from already unprofitable 2016/17 levels.

There is a long way to go before the final count is in. However, with less planted area and an expected return to trend line yields, the International Grains Council (IGC) pegged 2017/18 U.S. wheat production at 50.2 MMT, down 20 percent from 2016/17.

thumbnail

By Stephanie Bryant-Erdmann, USW Market Analyst

The USDA held its annual Agricultural Outlook Forum Feb. 23 to 24 where the 2017 Grain and Oilseeds outlook was presented. USDA currently estimates 2016/17 (June to May) wheat acreage at 46.0 million acres (18.6 million hectares), a nine percent decrease from last year.

USDA reported that winter wheat plantings are down 10 percent with the HRW crop having the largest decrease. HRW plantings fell by 12 percent to 23.3 million acres (9.43 million hectares). Soft red winter (SRW) plantings decreased by 300,000 acres (121,000 hectares) to 5.7 million acres (2.3 million hectares). USDA anticipates a 3 percent reduction in spring wheat plantings due to more favorable returns for other commodities. Currently, USDA’s spring wheat and durum acreage projection stands at 13.6 million acres (5.51 million hectares).

Due to the expected reductions in planted area and a return to trend line yields, production will decrease to a projected 50.0 MMT. If realized, that would be down 20 percent year-over-year. Based on trend yields, USDA expects the national average yield to fall to 47.1 bushels per acre (31.6 MT per hectare). USDA projects the wheat harvested-to-planted ratio will be 0.85, on par with 2016/17 and the 5-year average.

Though winter wheat planted area is at its lowest level in 108 years, growing conditions can greatly impact production levels as demonstrated in 2016/17. In February, winter wheat ratings declined in Illinois, Kansas, Montana, Nebraska, North Dakota and South Dakota, according to the monthly USDA Crop Progress report. The biggest change was noted in Montana, where USDA rated 5 percent of winter wheat in good to excellent condition compared to 70 percent in January. The percentage of Oklahoma wheat rated good to excellent increased to 43 percent, up from 33 percent in January. USDA reported 15 percent of Oklahoma wheat in poor or very poor condition, down from 17 percent in January, but significantly higher than the 1 percent poor or very poor on the same date last year. USDA resumes weekly crop progress reporting on April 3.

Large carryover stocks will partially offset the projected lower production, yet the forecast expects total U.S. supplies to decrease in 2017/18. USDA forecasts 2017/18 U.S. supplies at 84.3 MMT, down 9 percent from 2016/17, still 1 percent more than the 5-year average, if realized. Demand in the United States will decline in 2017/18, due to decreased feed usage. USDA anticipates a 2 percent decrease in domestic use, from 33.9 MMT to 33.1 MMT.

Smaller U.S. supplies and competition from other origins are expected to constrain U.S. wheat exports. USDA expects U.S. exports to decline slightly to 26.5 MMT, down 5 percent from the forecasted 2016/17 U.S. wheat export level of 27.9 MMT. U.S. ending stocks are forecast to decrease to 24.6 MMT, down 21 percent year-over-year but still 8 percent above the 5-year average.

To read more from the USDA Outlook Forum or to download presentations, please visit https://www.usda.gov/oce/forum/.

thumbnail

By Stephanie Bryant-Erdmann, USW Market Analyst

U.S. farmers made critical decisions last fall while they had bins full of wheat from record-breaking yields with prices near ten-year lows. Therefore, it is no surprise that many farmers chose to decrease their winter wheat planted area. USDA’s 2017/18 winter wheat seeding report released Jan. 12 reported U.S. farmers planted the second lowest number of winter whea­­t acres on record and 10 percent fewer acres than 2016/17. USDA estimated U.S. farmers planted 32.4 million acres (13.1 million hectares) of winter wheat with reductions for all three classes of winter wheat — HRW, soft red winter (SRW) and white winter wheat.

USDA assessed HRW planted area at 23.3 million acres (9.43 million hectares), down 12 percent from 2016. Planted area in Kansas, the number one U.S. HRW-producing state at 7.40 million acres (3.00 million hectares), is down 13 percent from 2016 and 20 percent below the 5-year average. Nebraska farmers planted a new record low area to winter ­­wheat of just 1.09 million acres (441,000 hectares), 25 percent below the 5-year average.

Total SRW planted area of 5.68 million acres (2.30 million hectares) fell 6 percent from 2016. Increases in Delaware, Georgia, Kentucky, Maryland, North Carolina and South Carolina were not enough to offset decreases in most of the other SRW-producing states, including a 16 percent decline in Ohio, the number one producer of U.S. SRW in 2016/17. USDA believes Ohio farmers planted 490,000 acres (198,000 hectares) of SRW, 15 percent below the 5-year average.

White winter wheat planted area decreased to 3.37 million acres (1.36 million hectares), down 4 percent from 2016/17. Exportable soft white wheat supplies are concentrated in Idaho, Oregon and Washington. Planted area in Idaho and Oregon fell 4 percent and 3 percent, respectively. Idaho farmers planted 730,000 acres (295,000 hectares) compared to 760,000 acres (308,000 hectares) in 2015/16 and 2016/17. Planted area in Oregon dropped 20,000 acres (8,000 hectares) from 2016/17 to 700,000 acres (283,000 hectares), while planted area in Washington remained stable year over year at 1.70 million acres (688,000 hectares).

Durum planting in the Southwestern United States is estimated at 140,000 acres (56,700 hectares), down 8 percent from 2016/17 and 38 percent below 2015/16. According to USDA, planting is well underway in Arizona at 22 percent complete, up 8 percentage points from the same date last year. Delays from wet conditions are slowing progress in California. Arizona and California plant durum from December through January for harvest in May through July.

With the decrease in planted area in the United States, customers should pay close attention to weather maps and consider purchasing farther out to protect themselves from supply shocks.

thumbnail

By Stephanie Bryant-Erdmann, USW Market Analyst

As the Dec. 9 World Agricultural Supply and Demand Estimate (WASDE) confirms, global wheat supplies are at a record high this year. USDA increased its estimate for 2016/17 global wheat production to 751 million metric tons (MMT), up 2 percent from 2015/16 and 6 percent above the 5-year average. USDA now forecasts Australian wheat production to reach a record 33.0 million metric tons (MMT), up 35 percent year over year, if realized.

Higher yields tend to be associated with lower protein. As discussed in the Nov. 3 Wheat Letter, quality test results from Stratégie Grains, UkrAgroConsult, Canadian Grain Commission and other international agricultural groups show lower-than-average protein in the supplies from wheat-exporting countries.

Lower average protein content is problematic for many end-users. According to work done by Shawn Campbell, USW Deputy Director, West Coast Office, nearly all of the world’s high protein wheat exports (13 percent protein on a 12 percent moisture basis or higher) originate from just six countries: Australia; Canada; Kazakhstan; Russia; Ukraine; and the United States. High protein wheat production in these countries accounts for an average one-fifth of their total production in a normal year.

High protein wheat supply and demand factors are driving the growing premium between the Minneapolis Grain Exchange (MGEX), which trades hard red spring (HRS), and the Chicago Board of Trade (CBOT) and Kansas City Board of Trade (KCBT), which trade soft red winter (SRW) and hard red winter (HRW), respectively. Last December the intermarket spread between MGEX and KCBT averaged 36 cents. Fast forward to this December, and the MGEX to KCBT spread averages $1.47.

If the same high-yield, lower-than-average protein correlation also plays out in Australia, there will be little help from that corner for buyers searching for high protein wheat, further supporting the MGEX to KCBT and MGEX to CBOT spreads.

The demand for higher protein wheat also supports HRW protein spreads, which have widened significantly this year at both Gulf and Pacific Northwest (PNW) ports. Over the past 15 years, the average premium for 12 percent protein (12 percent moisture) at the Gulf has been 12 cents per bushel. This year that premium is 46 cents per bushel. The 15-year average premium for 12 percent protein HRW at the PNW is $1.05 per bushel. Since the beginning of the 2016/17 marketing year on June 1, that average premium is $1.64 per bushel.

Despite the increasing premiums for higher protein HRW and HRS, U.S. HRW exports are 25 percent ahead of the 5-year average and U.S. HRS exports are 29 percent ahead of the 5-year average. While the average protein content of HRW exports this year is down from last year due to increased demand for all HRW, 12 percent protein shipments account for 31 percent of all HRW shipments to date, up from 27 percent last year. The brisk pace of HRW and HRS exports and anecdotal reports from traders indicate buyers are breaking from the hand-to-mouth buying pattern that has been prevalent this past year to secure supplies of higher protein wheat. Forward contracting for high protein needs now makes sense.

When evaluating competing prices of high protein wheat, buyers should be sure to convert protein values quoted to a common moisture basis. Because water can be readily removed (by drying) or added (by tempering), exporters quote protein using a fixed moisture basis, but they do not all use the same basis. The United States specifies protein on a 12 percent moisture basis. The European Union and the Black Sea region typically use a dry-matter (0 percent) moisture basis. Australia uses an 11 percent moisture basis and Canada uses a 13.5 percent moisture basis. Below is an example of how moisture basis impacts actual protein received, and the conversion equation.

Please call your local USW representative if you have any questions about the U.S. wheat marketing system, U.S. wheat supply or moisture basis calculations.

Country Moisture basis used Example: 13% Protein Protein Converted to

Dry-Matter Basis

Australia 11.0 13.0 14.6
Black Sea 0.0 13.0 13.0
Canada 13.5 13.0 15.0
European Union 0.0 13.0 13.0
United States 12.0 13.0 14.8

Equation to calculate protein content based on different moisture basis:

Example: You have a sample of wheat with 10 percent protein on a 13 percent moisture basis (mb) and want to convert to 12 percent mb.

Equation:    Protein1/(100-mb1) = Protein2/(100-mb2)

10/(100-13) = Protein2/(100-12)

10/87=Protein2/88

Protein2= (88*10)/87 = 10.1%