thumbnail

In 2015, the U.S. wheat industry expressed concern about a report by the non-regulatory International Agency for Research on Cancer (IARC) that moved to reclassify glyphosate as a “probable” human carcinogen, even though more than 25 years of several, separate studies had concluded that the mammalian toxicity levels of glyphosate are low and glyphosate is not carcinogenic.

On Nov. 9, 2017, the Journal of the National Cancer Institute (JNCI) published new research on the use of glyphosate by agricultural workers. The study found no association between exposure to glyphosate, “and any solid tumors or lymphoid malignancies overall, including non-Hodgkin Lymphoma…and its subtypes.”

This research was conducted as a part of the Agricultural Health Study (AHS), described on a website as “a prospective study of cancer and other health outcomes in a cohort of licensed pesticide applicators and their spouses from Iowa and North Carolina. The AHS began in 1993 with the goal of answering important questions about how agricultural, lifestyle and genetic factors affect the health of farming populations. The study is a collaborative effort involving investigators from the National Cancer Institute, the National Institute of Environmental Health Sciences, the Environmental Protection Agency and the National Institute for Occupational Safety and Health. More than 89,000 farmers and their spouses in Iowa and North Carolina have participated in the study. Their participation has provided, and continues to provide, the data that researchers need to help current and future generations of farmers and their families live healthier lives.”

Glyphosate is an active ingredient in many “non-selective” herbicide formulations. To learn more about how U.S. wheat farmers manage the use of glyphosate, visit the National Wheat Foundation for a five-part blog series on “The Facts About Glyphosate.”

This new research comes at an important time, as several U.S. agriculture groups, including the National Association of Wheat Growers (NAWG), recently “joined forces to file a lawsuit in federal court against the State of California for ignoring science and conclusions from regulatory bodies around the world in a fundamentally flawed regulatory classification of glyphosate.” The coalition’s case was filed in the U.S. District Court for the Eastern District of California. Read the full announcement here.

thumbnail

By Stephanie Bryant-Erdmann, USW Market Analyst

The common refrain right now is “the world is awash with wheat.” While that is true in the aggregate, in terms of milling wheat and, more specifically, high-protein milling wheat, supply is very tight. The impact of the small supply of high-protein milling wheat can be seen in the protein premiums for both U.S. hard red spring (HRS) and hard red winter (HRW) wheat. The following is a breakdown of pricing and availability of the U.S. high-protein wheat supply by class and port of export. Please note that U.S. wheat protein is expressed on a 12 percent moisture basis, not on a dry matter basis, thus U.S. 11.5 percent protein is equal to 13.1 percent protein on a dry matter basis.

Hard Red Winter

According to USDA, HRW production fell 32 percent from 2016/17 to 20.4 million metric tons (MMT), putting total HRW supply at 36.5 MMT. According to USW Crop Quality data, the average protein of this year’s HRW crop is 11.4 percent. That is similar to last year, but below the 5-year average. Overall, 55 percent of HRW samples were less than 11.5 percent protein; 26 percent had 11.5 to 12.5 percent protein and 19 percent had protein levels above 12.5 percent. Extrapolating that to HRW production, there is roughly:

  • 9 MMT of HRW with protein greater than 12.5 percent;
  • 3 MMT with protein between 11.5 and 12.5 percent; and
  • 2 MMT with less than 11.5 percent protein available.

The smaller crop and lower protein support both the Kansas City Board of Trade HRW futures market and protein premiums; however, that support varies by export tributary.

Gulf. The 2017/18 marketing year (beginning June 1) average protein premium for Gulf HRW 12.0 percent protein on a 12 percent moisture basis (mb) is 51 percent above the 2016/17 marketing average at $69 per metric ton (MT) and $20 dollars per MT above the 5-year average. The HRW Gulf export tributary region experienced its second consecutive year of higher yields and very limited heat stress during the growing season, resulting in lower than normal protein. According to USW Crop Quality data, the average protein for Gulf export tributary HRW is 11.2 percent, compared to the 5-year average of 12.8 percent protein. This means that while protein premiums for high-protein HRW are climbing, ordinary HRW from the Gulf represents a significant bargain for customers with export basis levels 31 percent below the 5-year average at $28/MT.

Pacific Northwest (PNW). Unlike the Gulf export tributary states, HRW in the PNW tributary states was stressed by high temperatures and little rainfall in 2017/18, boosting protein content but cutting yields. According to USW Crop Quality data, the average protein for PNW export tributary HRW is 12.0 percent, similar to the five-year average but higher than the average of 11.7 percent protein in 2016/17. USDA estimates the PNW HRW tributary states sampled by USW produced 3.5 MMT, or just 17 percent of the total U.S. HRW supply. With the PNW supply limited, albeit a supply with higher protein than the Gulf, the average price for 12.0 percent protein HRW is 9 percent higher than the 2016/17 value at $238/MT, but still well below the 5-year average of $277/MT. This represents an excellent opportunity for customers to lock in prices before supplies dwindle in the second half of the marketing year.

Hard Red Spring

According to USDA, HRS production fell 22 percent to 10.5 MMT in 2017/18. Total HRS supply declined 18 percent from 2016/17 to 20.8 MMT on smaller production and beginning stocks. According to USW Crop Quality data, the average protein of this year’s HRS crop is 14.6 percent. That is above both last year and the 5-year average of 14.0 percent. Overall, 22 percent of HRS samples tested had less than 13.5 percent protein; 23 percent of samples had 13.5 to 14.5 percent protein and 55 percent of samples had greater than 14.5 percent protein. If that is extrapolated out to HRS production, then roughly:

  • 8 MMT of HRS was produced with protein greater than 14.5 percent;
  • 4 MMT having protein between 13.5 and 14.5 percent; and
  • 3 MMT with less than 11.5 percent protein available.

This distribution caused protein premiums for HRS to fall below the 5-year average, but supported HRS MGEX futures, which spiked in July and remain an average $49/MT above last year’s futures prices due to the smaller supply. Like HRW, price impacts of the smaller supply vary by export tributary region but were more evenly distributed due to a nearly even production split between regions.

Eastern Region. The average cash price for Gulf HRS 14.0 percent protein is 16 percent above the 2016/17 marketing average at $298/MT. The higher price is supported by the extreme drought across the U.S. Northern Plains which cut production but boosted protein content. USW Crop Quality data showed the average protein for Gulf export tributary HRS was 14.4 percent, compared to the 5-year average of 14.0 percent protein.

Western Region. The drought had devastating effects on yields in the Western Region, specifically in Montana and western North Dakota and South Dakota, but did boost protein levels. According to USW Crop Quality data, the average protein for the PNW export tributary is 14.9 percent, compared to the 5-year average of 14.2 percent protein. With the increased availability of high-protein HRS, the average protein premium for 14.0 protein HRS fell 10 percent year over year to $53/MT, well below the 5-year average of $67/MT.

With Canadian wheat production falling an estimated 5.5 MMT year over year and the sharp drop in U.S. high-protein wheat production, the global supply of high-protein wheat has tightened. Depending on what protein specifications customers need, this may be the best time to lock in lower HRS protein premiums. Low-protein HRW also represents an excellent buying opportunity for specific customers.

thumbnail

By Stephanie Bryant-Erdmann, USW Market Analyst

USDA’s Sept. 30 Small Grains Summary reported that U.S. farmers harvested 37.6 million acres (15.2 million hectares) of wheat for the 2017/18 crop, a 14 percent reduction from 2016/17 and the smallest harvested area since 1890. USDA estimated U.S. 2017/18 wheat production at 47.4 million metric tons (MMT) (1.74 billion bushels), down 25 percent year over year and 15 percent below the 5-year average. The smallest planted area since USDA record began in 1919, adverse weather conditions and wheat streak mosaic virus all contributed to reduced harvested area.

The largest beginning stocks since 1988/89 will partially offset lower production. USDA expects 2017/18 U.S. beginning stocks to total 32.2 MMT (1.18 billion bushels), up 21 percent year over year and 57 percent greater than the 5-year average. Total 2017/18 U.S. wheat supply is forecast at 79.6 MMT (2.92 billion bushels), down 11 percent from 2016/17 but in line with the 5-year average. Despite the sharp year over year reduction in yields, USDA expects the final average yield to reach 46.3 bu/acre (3.11 MT/ha), similar to the 5-year average of 46.6 bu/acre (3.13 MT/ha).

Last fall, low farm gate prices and large carry-in stocks prompted U.S. farmers to plant 32.7 million acres (13.2 million hectares) of winter wheat, down 9 percent from 2016/17. The winter wheat crop went into winter dormancy in good or above average condition. A mild winter and early spring was beneficial for both winter wheat and, unfortunately, the mites that carry wheat streak mosaic virus. The disease was widespread in Kansas, Oklahoma and parts of Nebraska, cutting yields and causing higher rates of abandonment in affected hard red winter (HRW) areas. A late spring blizzard in western Kansas cut yields and increased abandonment. Soft red winter (SRW) generally came out of dormancy in better than normal conditions, but growing conditions also varied widely across the Southeast. In some areas, excessive moisture helped boost yields, in others it delayed or prevented emergence.

As with winter wheat, low spring wheat and durum farm gate prices and large carry-in stocks reduced planted areas. After planting (which is generally early), drought conditions spread across Montana, North Dakota and South Dakota with devastating effects on yield. As a result, the rate of abandonment in South Dakota, which was particularly hard hit, is estimated at 37 percent — nearly triple the state’s 5-year average.

Here is a by-class breakdown of the Sept. 30 report.

Hard Red Winter (HRW). USDA estimates total 2017/18 HRW production fell to 20.4 MMT (750 million bushels), down 31 percent from 2016/17 and 15 percent below the 5-year average. USDA forecast 2017/18 HRW beginning stocks at 16.1 MMT (593 million bushels), up 33 percent year over year and 81 percent above the 5-year average. Even with large beginning stocks, total HRW supply will fall 12 percent year over year to 36.5 MMT (1.34 billion bushels). Total HRW planted area fell to 23.8 million acres (9.63 million hectares), down 10 percent from 2016/17. Yields also fell an average 13 percent from 2016/17 in the top HRW-producing states of Texas, Oklahoma and Kansas.

Hard Red Spring (HRS). USDA estimates total 2017/18 HRS production fell to 10.5 MMT (385 million bushels), down 22 percent from 2016/17 and 26 percent below the 5-year average. USDA forecast 2017/18 HRS beginning stocks at 6.40 MMT (235 million bushels), down 14 percent year over year but still 21 percent above the 5-year average. Total HRS supply will fall 12 percent year over year to 16.9 MMT (620 million bushels). USDA estimates farmers planted 10.3 million acres (4.17 million hectares) to HRS, 10 percent below 2016/17 levels. The drought cut yields an average of 11 bu/acre (0.74 MT/ha) in Montana, North Dakota and South Dakota. Abandonment in Montana and North Dakota was double the respective 5-year averages at 9 and 6 percent, and South Dakota farmers abandoned 37 percent of wheat fields due to the drought. The single bright spot for HRS production was Minnesota, with a record high average yield of 67.0 bu/acre (4.50 MT/ha) offsetting lower harvested area.

Soft Red Winter (SRW). USDA estimates total 2017/18 SRW production fell to 7.95 MMT (292 million bushels), down 15 percent from 2016/17 and 32 percent below the 5-year average. USDA reported 24 percent of SRW acres were abandoned compared to 17 percent last year. Record high yields in six SRW producing states partially offset the lower harvested area. USDA forecast 2017/18 SRW beginning stocks at 5.85 MMT (215 million bushels), up 37 percent year over year and 47 percent greater than the 5-year average. So, total SRW supply will rise slightly year over year to 13.8 MMT (507 million bushels). USDA estimates total 2017/18 SRW planted area at 5.61 million acres (2.27 million hectares), 15 percent lower than 2016/17 and 30 percent below the 5-year average.

Soft White (SW). USDA estimates total 2017/18 SW production declined to 6.14 MMT (226 million bushels), down 11 percent from 2016/17 due to small declines in harvested area and average yields in Washington and Idaho that were down 7 and 10 percent, respectively. USDA reports white wheat planted area decreased 3 percent year over year. White wheat planted area fell to 4.02 million acres (1.63 million hectares), 2 percent below the 5-year average. USDA projected white wheat beginning stocks will increase 42 percent year over year to 3.02 MMT (105 million bushels). If realized, that would be 65 percent above the 5-year average.

Durum. U.S. durum production fell 51 percent in 2017/18 to 1.49 MMT (54.9 million bushels) from lower planted area and yields in Montana, North Dakota and South Dakota. USDA estimates 1.91 million acres (773,000 hectares) were planted to durum, down 11 percent from 2016/17 but still 6 percent above the 5-year average of 1.80 million acres (729,000 hectares). Abandonment also increased this year from 2 percent in 2016/17 to 8 percent in 2017/18, due to the drought. USDA projected 2017/18 durum beginning stocks to climb to 980,000 metric tons (MT) (36 million bushels), nearly double the 5-year average and 29 percent above 2016/17 levels. USDA forecast total U.S. durum supply at 2.48 MMT (91 million bushels), down 31 percent year over year.

thumbnail

By Stephanie Bryant-Erdmann, USW Market Analyst

USDA’s latest forecast of total world wheat production stands at 745 million metric tons (MMT), down 1 percent from 2016/17. Though USDA expects global wheat production to decrease by 8.46 MMT, it expects global wheat consumption to remain high at 737 MMT, down 1.13 MMT from the 2016/17 record. With lower production and stable consumption, staying abreast of the location and quality of the 2017/18 wheat crop is key. The following is a look at production and quality expectations for major exporting regions and countries outside the United States.

Black Sea. On Sept. 15, Russia’s Ministry of Agriculture reported wheat harvest was 84 percent complete. To date, the reported average yield is 3.51 metric tons per hectare (MT/ha) (52.2 bu/acre) compared to 2.95 MT/ha (43.9 bu/acre) on the same date in 2016. Russian consultancy SovEcon forecast 2017/18 Russian wheat production at 81.1 MMT, up 13 percent from 2016/17. Strategie Grains reported that Ukrainian farmers harvested 26.0 MMT of wheat this year, on par with 2016/17. Kazakhstan wheat harvest is underway, and Strategie Grains pegged 2017/18 Kazakh wheat production at 14.2 MMT, which would be down 5 percent from 2016/17. USDA expects Black Sea exports to total 56.5 MMT, up 7 percent from 2016/17, if realized.

SGS Russia, an independent crop inspection service, reported preliminary quality data for winter wheat in Russia’s South, Central and Volga-Urals regions, which showed lower protein levels due to favorable growing conditions and high yields. According to the SGS data, 52 percent of the samples graded as Russian 4th class wheat, up from 46 percent of samples in 2016/17. Russian 4th class wheat has between 8.8 and 10.5 percent protein on a 12 percent moisture basis. Though the percentage of samples that graded 3rd class wheat (10.5 to 11.9 percent protein on a 12 percent moisture basis) and 5th class (feed wheat) decreased in 2017/18, impacts on supplies of those two classes are expected to be minor due to record large production. SGS reports that some areas have Fusarium damage, high levels of sprout damage and very low falling numbers; but test weight values are generally higher across all regions. SGS reports the average protein of Ukraine’s 2017/18 wheat crop is 10.1 percent (12 percent mb) compared to 10.5 percent in 2016. The crop has higher average moisture and higher bug damage compared to 2016 per SGS.

Canada. In its Sept. 15 report, Agriculture and Agri-Food Canada (AAFC) projected 2017/18 wheat production (excluding durum) to be 21.6 MMT, down 10 percent from 2016/17. A 1 percent increase in planted area was more than offset by sharply lower yields. AAFC expects total Canada Western (Hard) Red Spring (CWRS) to account for 74 percent of total Canadian wheat production at 16.1 MMT. Canadian durum production is estimated at 3.90 MMT, down 50 percent year over year due to a 16 percent decrease in planted area and lower than average yields.

According to Alberta crop reports, favorable conditions are allowing harvest to proceed rapidly. As of Sept. 12, 50 percent of the crop was harvested compared to 31 percent at this time last year. Hot, dry conditions are aiding Saskatchewan wheat harvest as well. As of Sept. 14, Saskatchewan spring wheat and durum harvests were 63 and 81 percent complete, respectively, compared to 38 and 62 percent complete the week prior and significantly better than last year when frequent rainfall delayed harvest. Preliminary durum grade data from the Saskatchewan weekly crop report shows 97 percent of the crop graded as #1 or #2 Canadian Western Amber Durum (CWAD). On average, Saskatchewan produces 85 percent of the Canadian durum crop.

European Union. Stratégie Grains (SG) forecast total European Union (EU) wheat production at 151 MMT, up 4 percent year over year due to a return to normal production levels in France. Durum production is expected to decrease to 8.9 MMT, down from 9.9 MMT in 2016/17, but common (non-durum) wheat production will climb 5 percent to 142 MMT. After a disastrous 2016/17 French harvest when late rain damaged yields and quality, 2017/18 French wheat production rebounded to 37.4 MMT, up 31 percent year over year. SG noted French wheat quality is very good, but rain at harvest hurt German and Polish wheat quality. SG estimated EU milling quality wheat output at 66 percent of total 2017/18 production, putting total EU common wheat milling quality production at 93.9 MMT. That is in line with the 5-year average and 12 percent greater than 2016/17. SG expects EU total wheat exports to fall to 23.1 MMT, down 4 percent year over year, if realized, due to quality issues in Germany and increased competition from the large Black Sea supply.

Argentina. Bolsa de Cereales Buenos Aires (Buenos Aires Grain Exchange) recently estimated farmers in Argentina planted 5.35 million hectares (13.2 million acres) of wheat in 2017/18, up 5 percent from 2016/17. As of Sept. 7, Bolsa rated 71 percent of Argentine wheat in very good to excellent condition compared to 63 percent the prior year. However, excessive moisture is preventing fieldwork in some areas and threatening emerging wheat plants. The International Grains Council (IGC) pegged Argentine wheat production at 16.5 MMT, down 6 percent from 2016/17 if realized. With carry-in stocks expected to remain stable year over year at 600,000 MT, Argentine supply will also decrease 6 percent from 2016/17 to 17.1 MMT. IGC expects Argentina to export 10.5 MMT, down from 11.5 MMT in 2016/17 due to the smaller supply.

Australia. The Australian Bureau of Agricultural and Resource Economics and Sciences (ABARES) forecasts 2017/18 wheat production at 21.6 MMT, down 38 percent from 2016/17 due to a 3 percent reduction in planted area and sharply lower yields. Australian farmers decreased planted wheat area for 2017/18 to 12.4 million hectares. A drier than normal winter has depleted soil moisture reserves in the many wheat-producing areas, which need timely rains to maintain current yield potential. USDA expects Australian exports to increase to 18.5 MMT, down 20 percent from 2016/17 and 1 percent below the 5-year average.

Together with its partner organizations across the United States, USW is testing more than 2,000 samples of wheat this year for its annual Crop Quality survey. The preliminary results are reported every Friday in the USW Harvest Report, and the final results for all classes are published in by-class reports and in our annual Crop Quality Report near the end of October. Please contact your local USW representative for more information about the USW Crop Quality survey, report or seminars.

thumbnail

By Stephanie Bryant-Erdmann, USW Market Analyst

USDA increased its estimates for world wheat production, consumption and trade in its August World Agricultural Supply and Demand Estimates (WASDE) report released today. USDA forecast global wheat production at 743 million metric tons (MMT), 3 percent above the 5-year average but still 2 percent below last year’s record. The global wheat consumption estimate increased to 737 MMT in 2017/18, up 4 percent from the 5-year average but down slightly from the 2016/17 record. USDA projects 2017/18 world wheat trade at 180 MMT, down 1 percent from last year but still 10 percent above the 5-year average, which would be the second highest on record. USDA also lowered its U.S. and Canada spring wheat supply estimates.

USDA forecasted U.S. wheat production to fall 25 percent year over year to 47.3 MMT. The drop is due to lower yields for spring wheat and durum as a result of the drought across the U.S. Northern Plains, but does not reflect abandoned acre data. USDA pegged U.S. spring wheat production at 9.91 MMT, down 26 percent from 2016/17 and 30 percent below the 5-year average, if realized.

Total 2017/18 U.S. spring wheat supply, which USDA pegged at 16.3 MMT, is down 22 percent from 2016/17 and results in a U.S. spring wheat stocks-to-use ratio of 24 percent. The ratio was 44 percent in the August 2016 WASDE and 51 percent in the August 2015 report. The current low stocks-to-use ratio seems supportive for U.S. spring wheat prices. Many in the industry believe supply will decrease further when abandoned acres are determined.  The North Dakota Wheat Commission noted in Assessing the Wheat Quality Council Tour 2017 Yield Estimate (below), …abandoned acres will certainly have a significant impact on final production for both spring and durum, but may not be fully reconciled until USDA releases its final harvested acreage report for the 2017 crops.”

The drought that is impacting the United States is also decreasing yield potential in Canada. USDA now estimates 2017/18 Canadian wheat production will total 26.5 MMT, down 16 percent from the prior year. The United States and Canada normally account for 60 percent of global high protein wheat exports.

Favorable spring wheat growing conditions in Russia and Kazakhstan may partially offset lower North American spring wheat production. Time will tell what quality and quantity of spring wheat is available for export, and at what value. Customers should remain abreast of current crop conditions, harvest conditions and U.S. prices and contact their local USW representative for any questions concerning the 2017/18 U.S. wheat crop.

Harvest Report

Reprinted with Permission from “Agweek,” August 2, 2017

[Editor’s Note: The original source for this article is the North Dakota Wheat Commission.]

The annual Wheat Quality Council (WQC) tour of the spring and durum wheat region took place the week of July 24, with the final yield result sparking questions and sharp criticism, especially in social media circles. The North Dakota Wheat Commission (NDWC) would like to acknowledge these concerns from producers, assess the crop tour yield estimate, and clarify some misinformation.

The wheat tour is organized by the WQC, based in Kansas City, not the NDWC. The tours are just a small part of the overall mission of the Council. Its primary focus is being a collaboration point and organization to test and evaluate new wheat varieties for end-use quality, and to ensure U.S. wheat production is meeting the quality needs of the wheat industry. It also serves to expand communication and education between wheat producers, wheat breeders, millers, bakers and other end-users.

The tour calculated an average yield of 38.1 bushels per acre for hard red spring wheat. While this is the lowest yield in about ten years for the tour, it was higher than expected by many producers, considering the severe drought conditions gripping nearly all western North Dakota. The NDWC agrees that this overall yield was higher than we anticipated based on weekly crop ratings and producer reports, and the WQC average yield needs to be looked at in its full context.

Why was the tour estimate higher than expected? Most routes covered central and eastern parts of the state, and higher yielding areas of Minnesota, with a lower than normal percent of field counts in western areas. This was not done intentionally; the tour has never taken routes into the far west portion of the state or into eastern Montana (also in severe drought). In more normal years when crop conditions are more balanced across the region, this has not been as big of an issue. However, in a drought year like this with high abandonment, it led to a lower than normal percent of field counts from western areas. The yield estimates given at the end of each day and at the end of the tour are simple averages. They are not weighted by production and there are no county yield estimates released. For durum, the average yield came in at 39.7 bushels per acre, which is well above the July USDA estimate of 27 bushels per acre for North Dakota. The tour routes did not cover the main durum producing counties in the state, which are facing the most intense drought conditions.

Accounting for abandoned acres is difficult, since yield reports are based on actual acres harvested for grain, not planted acres. It is well known that large portions of the crop are being abandoned due to the drought conditions in western growing regions, including South Dakota and Montana. Participants on the tour noted that on some routes, anywhere from 30 to 50 percent of the fields had been abandoned.

These abandoned acres will certainly have a significant impact on final production for both hard red spring and durum, but may not be fully reconciled until USDA releases its final harvested acreage report for the 2017 crops. Normal abandonment rates in the spring wheat region are 2 to 3 percent. The eastern acres will likely see normal abandonment, but portions of the western drought areas could be as high a 40 percent. In 2002, North Dakota abandoned 13 percent of its wheat plantings, and the rate was 23 percent in the 1988 drought. The question of abandonment is a concern in the market and once fully understood, it will have a big impact on final production; it is something buyers, producers and all involved in the wheat industry will need to focus on.

USDA’s July production report projected an average spring wheat yield of 38 bushels for North Dakota, 61 bushels for Minnesota, 26 for Montana, and 34 for South Dakota. All the USDA data is based directly on producer surveys with no objective yield surveys taken in fields. The upcoming August and September USDA estimates will follow the same pattern for yield, but it is uncertain when major adjustments for abandoned acres will be included. In its July estimate, USDA pegged planted acres of spring wheat in Montana, South Dakota and North Dakota at 8.55 million, and harvested at 8.22 million, reflecting a 4 percent abandonment level. For durum in Montana and North Dakota, it pegged planted acres at 1.75 million, with expected harvested acres at 1.7 million, just 3 percent abandoned. If final harvested area ratios fall to levels seen in 2002 across the region, there is another 1 million acres that need to be taken out from final production equations. This is a significant number, and some producers say it will be even higher.

Emotions are high this growing season, especially for producers in the heart of the severe drought conditions. The unexpected higher yield estimate and decline in prices since the beginning of July due to several factors has intensified these emotions. The wheat tour result is just one piece of information the markets react to. Two of the three days of the tour, the market moved higher, with analysts citing other factors as well, such as technical sell points, corn and soybean weather forecasts, and the start of spring wheat harvest impacting trends. The final harvest and yield report from producers themselves, as well as a full recognition of abandoned acres, and both domestic and international demand factors, will be the final driving forces in establishing the value of the 2017 crop.

When the full extent of the drought-impacted production areas is considered, it certainly appears the tour overestimated both spring wheat and durum yield potential in 2017. For durum, it is significant since likely two-thirds of the main region was not part of the survey routes. For spring wheat, it may not be as significant because there is strong yield potential in the eastern third of [North Dakota and] into Minnesota that will offset some, but not all, of the reduction in harvested acres in the west … Tour organizers have noted the strong negative reaction from producers from the final tour yield results. And also heard from the NDWC and producers during the tour about concerns over the lack of accounting for abandoned acres and lack of field counts in western areas. It will lead to some reevaluation of routes in future tours, or recognition of the need to weight yield counts to better account for significant crop condition difference between regions.

The tour has been conducted for more than 20 years, and has provided a great opportunity to build connections between producers in this region and some of its most important customers. This year may have added some challenges, but it also provides an opportunity to expand communication along all segments of the industry. Milers and other end-users of wheat grown in our region need to have producers be successful, for them to be successful.

thumbnail

By Erica Oakley, USW Director of Programs

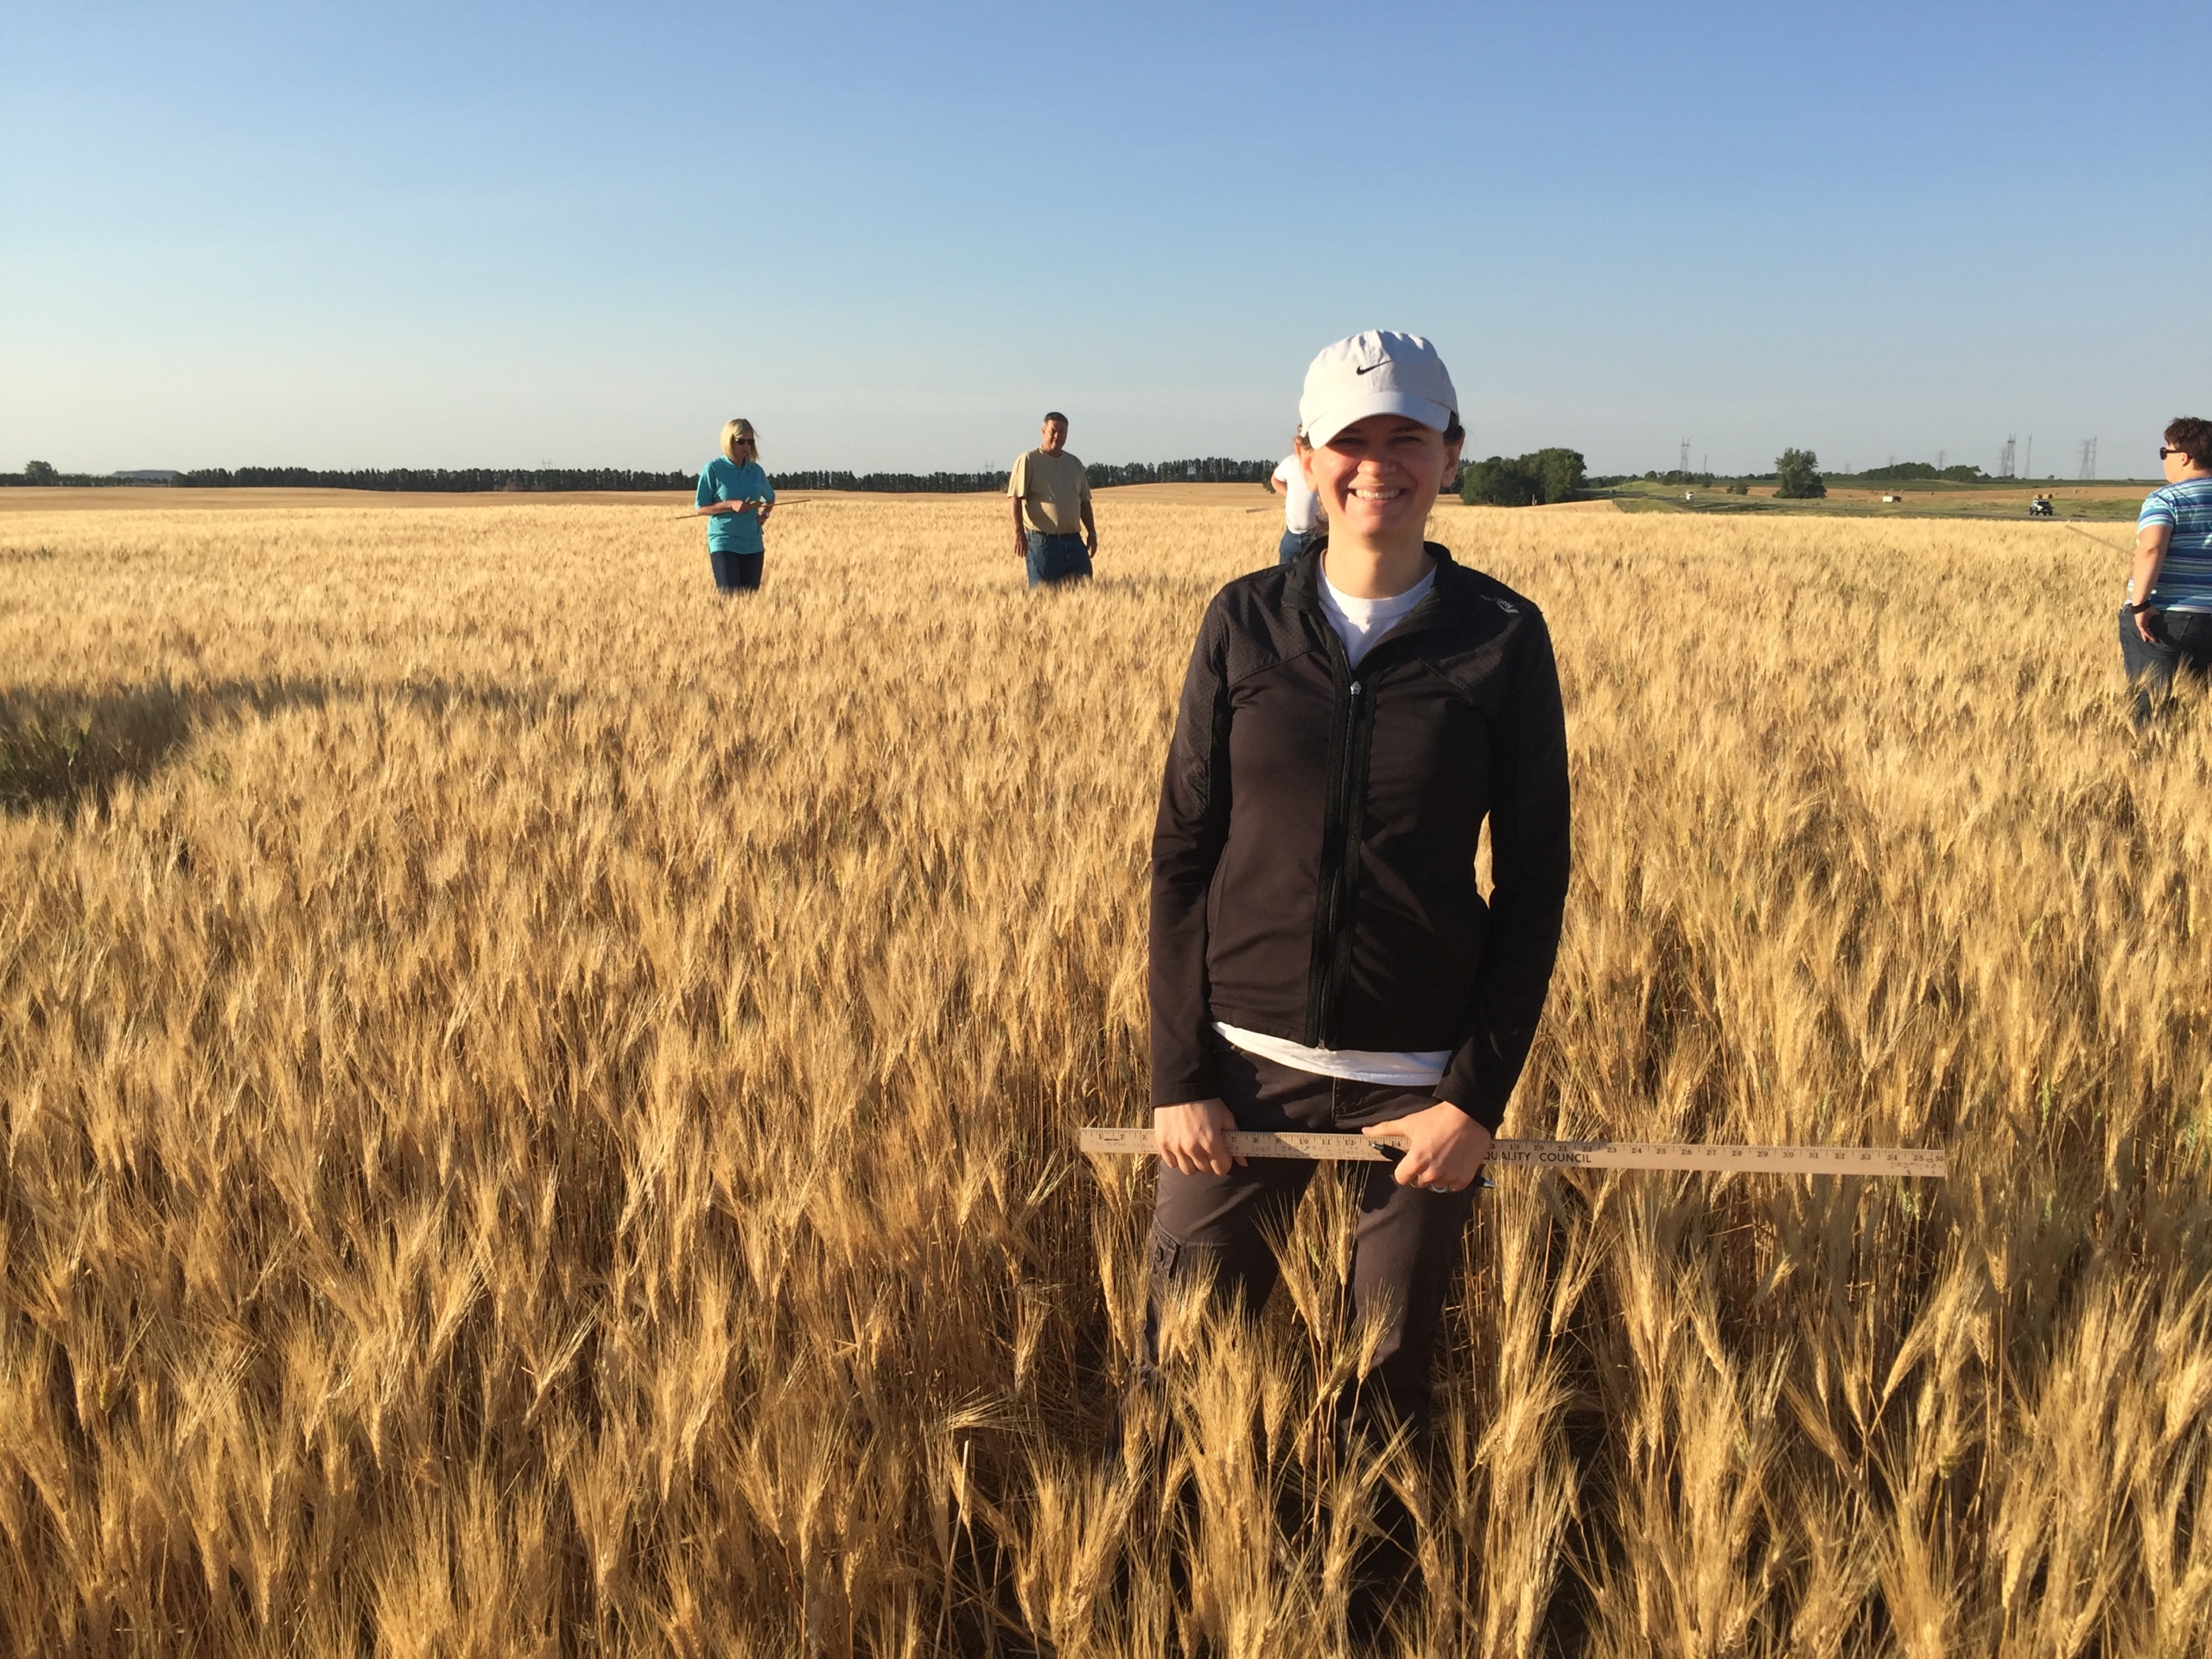
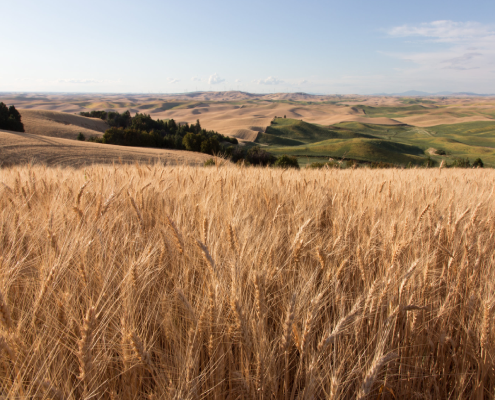
This week, the Wheat Quality Council hosted its annual hard red spring (HRS) and durum crop tour. Participants spent three days in North Dakota surveying this year’s crop and estimating yield. The tour, which surveyed a total of 496 fields, estimated weighted average HRS yield at 38.1 bushels per acre (bu/a), significantly lower than last year’s HRS average of 45.7 bu/a because of ongoing drought conditions in western areas. The durum weighted average yield was 39.7 bu/a, down from 45.4 bu/a in 2016. Results from six HRW fields showed a weighted average of 46.6 bu/a.

Participants on the tour always represent a wide range of the wheat industry, including millers, traders, media, farmers, researchers and government officials. There were 76 participants on this tour, who traveled along eight distinct routes covering most of the state’s wheat production. I joined my USW colleague Assistant Director of Policy Elizabeth Westendorf on the tour.

It was insightful to see the conditions on the ground after reading reports about the drought. It was also interesting to see the difference in field conditions along each of the routes over all three days.

On the first day, participants drove between Fargo and Bismarck, with two routes going farther into the western part of the state, and others covering western Minnesota and northern South Dakota. Conditions on the eastern side looked good, though there was evidence of drought stress. Reports from the west included evidence of much more severe conditions. The Day 1 weighted average yield was 38.8 bu/a, down from 42.9 bu/a in 2016. For HRS specifically, the yield was 37.9 bu/a, down from 43.1 bu/a in 2016. The scouts surveyed 207 fields on Day 1, of which 194 were HRS, 10 durum and three HRW.

On Day 2, the tour surveyed 225 fields, 188 of which were HRS; along with 34 durum and 3 HRW. The group moved from Bismarck to Devils Lake. The more western routes reported drought stress, though not as severe as the scouts saw in southwestern North Dakota on Day 1. Overall average for Day 2 was 35.7 bu/a, down from 46.5 in 2016. For HRS, the yield was 35.8 bu/a, down from 46.9.

The third day of the tour included a half day of crop surveying. The participants then all returned to North Dakota State University’s Northern Crops Institute in Fargo to compile the overall crop report. On Day 3, participants surveyed at total of 61 HRS fields and three durum fields. The Day 3 weighted average yield for HRS was 46.2 bu/a, down from 51.9 bu/a in 2016. The weighted average durum yield from just three fields was 46.2 bu/a, down from 52.1 bu/a in 2016.

The results reflect a snapshot of yield potential observed by the participants in the fields they scouted.

“There is still a question of abandonment because of the dryness,” said Dave Green, executive vice president of the Wheat Quality Council. “We do not yet know how much of the crop has been hayed — how much of it has been plowed under.”

View highlights and photos from the tour by searching #wheattour17 on Facebook and Twitter. For more information and for results from previous tours, visit the Wheat Quality Council’s website at www.wheatqualitycouncil.org.

thumbnail

USDA forecast U.S. 2017/18 wheat production at 47.9 million metric tons (MMT), down 24 percent year over year and 18 percent below the 5-year average. The reason: an anticipated 12 percent decline in average yield and the lowest planted acres since USDA records began in 1919. However, USDA expects 2017/18 U.S. beginning stocks to total 32.2 MMT, up 21 percent year over year and the most since 1988/89. As a result, total 2017/18 U.S. wheat supply is forecast at 80.1 MMT, down 10 percent from 2016/17 but still 1 percent above the 5-year average of 79.3 MMT. USDA expects average yield to be 46.2 bu/acre (3.10 MT/ha), which is close to the 5-year average of 46.6 bu/acre (3.13 MT/ha).

On June 30, USDA estimated total planted wheat area would fall 9 percent year over year to 45.7 million acres (18.5 million hectares). If realized, that would be 17 percent lower than the 5-year average. USDA expects 2017/18 harvested area to drop 13 percent from last year and 18 percent below the 5-year average to 38.1 million acres (15.4 million hectares).

USDA forecast 2017/18 hard red winter (HRW) production to total 20.6 MMT, down 30 percent from 2016/17 and 14 percent below the 5-year average. A smaller planted area and sharply lower harvested area led to the decline. U.S. farmers planted 23.8 million acres (9.63 million hectares) of HRW for 2017/18, down 10 percent from 2016. Due to weather and wheat streak mosaic virus, harvested area in top HRW-producers Texas, Oklahoma and Kansas is projected to fall 16 percent year over year. USDA forecast 2017/18 HRW beginning stocks at 16.1 MMT, up 33 percent year over year and 81 percent above the 5-year average. Total 2017/18 HRW supply is expected to total 36.8 MMT, down 12 percent from 2016/17.

Soft red winter (SRW) production is also expected to decline 11 percent to 8.33 MMT in 2017/18 due to fewer planted acres. USDA estimated total 2017/18 SRW area at 5.61 million acres (2.27 million hectares), 15 percent lower than 2016/17 and 30 percent below the 5-year average. In contrast to recent years, SRW harvest in the U.S. Southern Plains is progressing rapidly with good harvest conditions. On July 7, the USW Weekly Harvest report showed the average grade on 199 samples was U.S. #2 in a generally sound crop with DON levels that are significantly below the 5-year average. USDA estimates that SRW 2017/18 beginning stocks totaled 5.85 MMT, up 37 percent from 2016/17 and 47 percent above the 5-year average. The larger beginning stocks will offset reduced production, and total 2017/18 SRW supply is expected to increase by 500,000 MT year over year to 14.2 MMT.

USDA reported white wheat production will decrease 11 percent from 2016/17 to 6.91 MMT, but still 1 percent above the 5-year average, if realized. The decline is due to 3 percent fewer planted acres and slightly lower forecast yields. Idaho, Oregon and Washington have received ample moisture and winter wheat conditions there average 78 percent good to excellent. USDA estimates soft white (SW) beginning stocks increased 42 percent year over year to 2.86 MMT. The larger beginning stocks are expected to offset the lower production, leaving the 2017/18 SW supply unchanged year over year at 9.77 MMT.

Hard red spring (HRS) production is expected to plummet in 2017/18 to 10.5 MMT, down 22 percent from the prior year and the lowest since 2002/03, if realized. The average spring wheat yield is forecast at 40.3 bu/acre (2.73 MT/ha), down 15 percent from 2016/17. USDA also estimates farmers planted 10.3 million acres (4.17 million hectares) to HRS, 10 percent below 2016/17 levels. As of July 11, 55 percent of North Dakota is in a severe or extreme drought and the remainder of the state is abnormally dry or in a moderate drought. Similarly, 72 percent of South Dakota and 45 percent of Montana are in a moderate to extreme drought. As of July 10, just 35 percent of the spring crop was rated good or excellent and 39 percent was poor or very poor. In North Dakota, the largest HRS producing state, 36 percent of the crop is in good or excellent condition. USDA anticipates 2017/18 HRS beginning stocks of 6.39 MMT are 14 percent less than last year. Estimated 2017/18 HRS supply will total 16.9 MMT, down 19 percent year over year. USDA expects the HRS stocks-to-use ratio to fall to 22 percent in 2017/18, compared to 41 percent one year prior.

Smaller planted area and 30 percent lower yields are expected to reduce durum production to 1.55 MMT in 2017/18, down an estimated 45 percent from 2016/17 and 26 percent below the 5-year average. USDA expects average durum yields to sink to 30.9 bu/acre (2.08 MT/ha), compared to 44.0 bu/acre (2.96 bu/acre) in 2016/17. Durum planted area decreased this year as farmers responded to lower prices and large carry-out stocks. Spring-planted northern durum is grown primarily in North Dakota and Montana, and the Desert Durum® harvest in Arizona and California is nearly complete. USDA estimates 2017/18 durum beginning stocks at 980,000 MT, up 29 percent from the prior year and 45 percent greater than the 5-year average. Increased beginning stocks will not offset the drastically reduced 2017/18 production so USDA expects the U.S. durum supply will fall to 2.53 MMT, 29 percent below 2016/17 levels and 9 percent below the 5-year average. The U.S. durum stocks-to-use ratio will fall to 24 percent, on par with the 5-year average.

Even with reduced production for 2017/18, U.S. farmers stored significant amounts of grain last year, ensuring that customers can continue purchasing reliable, high-quality wheat. Customers are encouraged to contact their local USW representative to discuss purchasing strategies in this volatile global wheat market.

thumbnail

By Stephanie Bryant-Erdmann, USW Market Analyst

With wheat harvest underway in the Northern Hemisphere and wheat planting underway or complete in the Southern Hemisphere, wheat buyers are beginning to see a downward trend in production numbers. As discussed in the June 15 Wheat Letter, the high quality, high protein wheat supply is shrinking and supporting prices. USDA expects global output to decrease for the first time in five years to 739 million metric tons (MMT) (27.2 billion bushels), down 14.6 MMT (535 million bushels) from the 2016/17 record of 754 MMT (27.7 billion bushels). If realized, production would be 3 percent above the five-year average. In this issue, we summarize current expectations and conditions in the world’s major wheat exporting countries, which account for 90 percent of all world wheat exports.

Argentina. In June, Bolsa de Cereales, the Buenos Aires Grain Exchange, reported Argentine farmers will plant 17 percent more wheat acres in 2017/18 as wheat production continues to expand under President Macri’s favorable policies. Bolsa estimated wheat planted area at 13.6 million acres (5.5 million hectares). On June 22, 53 percent was planted, up from 37 percent the prior week. USDA’s July estimate for 2017/18 Argentinian wheat production was 17.5 MMT (643 million bushels), up 3 percent from 2016/17 and 41 percent greater than the five-year average.

Australia. In its June report, the Australian Bureau of Agricultural and Resource Economics and Science (ABARES) forecasted 2017/18 production at 24.2 MMT (889 million bushels). That is 31 percent below 2016/17, due to an expected 25 percent reduction in average yield and a slight decline in planted area from 2016 to 31.4 million acres (12.7 million hectares). Autumn rainfall was below normal in Western Australia and variable across South Australia, states that account for roughly half of Australia’s winter crop planted acres and production. The Australian Bureau of Meteorology expects drier than average conditions across wheat producing regions during the next three months.

Black Sea. Winter wheat harvest is underway and USDA projects combined 2017/18 output from Russia, Ukraine and Kazakhstan will decrease 6 percent to 107 MMT (3.93 billion bushels) based on an expected return to trendline yields. If realized, the combined harvest would still be greater than the five-year average. Russian consultancy SovEcon pegged Russian planted wheat area at 68.9 million acres (27.9 million hectares), down slightly from 2016/17 due to a 4 percent decrease in spring wheat area. Russian wheat production is expected to decline to 70.4 MMT (2.59 billion bushels), down 3 percent from 2016/17 due to the smaller planted area and anticipated lower yields. SovEcon forecast Russian winter wheat yields at 52.1 bu/acre (3.50 MT/ha), down from 55.5 bu/acre (3.73 MT/ha) in 2016/17. Spring wheat yields are expected to fall 7 percent year over year to 21.1 bu/acre (1.42 MT/ha). UkrAgroConsult reported Ukrainian wheat planted area decreased slightly year over year to 15.6 million acres (6.30 million hectares), and expects yields to fall 7 percent year over year to 58.2 bu/acre (3.91 MT/ha). 2017/18 Ukrainian wheat production is forecast at 24.5 MMT (900 million bushels), compared to 26.1 MMT (959 million bushels) in 2016/17. UkrAgroConsult noted yield declines and a 3 percent smaller planted area will lower Kazakhstan wheat production to 13.7 MMT (503 million bushels), down 9 percent from 2016/17, if realized.

Canada. Agriculture and Agri-Food Canada (AAFC) expects wheat production of 29.5 MMT (1.08 billion bushels) in 2017/18. That is down 7 percent year over year because average yield is expected to decline to 47.6 bu/acre (3.20 MT/ha) in 2017/18. Slightly higher planted area will partially offset expected yield declines. StatsCan put planted area at 22.4 million acres (9.07 million hectares) of wheat in 2017/18. Spring wheat planted area rose 2 percent to 15.8 million acres (6.39 million hectares) due to low carry-in stocks and increased price competitiveness with alternative crops. Durum planted area decreased 16 percent year over year to 5.2 million acres (2.11 million hectares) due to high carry-in stocks and lower prices. Canada’s winter wheat seeding decreased 16 percent year over year from a shift to spring wheat. Crop conditions this year are variable with excessive moisture in northern areas while southern areas remain dry. As of June 23, topsoil moisture in Saskatchewan was rated 18 percent short or very short compared to 40 percent short or very short last week. In Alberta, 84 percent of spring wheat is rated in good to excellent condition compared to 83 percent last year. Surface soil moisture is rated 79 percent good to excellent; 14 percent of surface soil moisture is rated excessive. Saskatchewan and Alberta account for roughly 82 percent of 2017/18 planted wheat acres.

European Union. After a challenging 2016/17, Strategie Grains expects EU common wheat production will rebound 4 percent to 142 MMT (5.20 billion bushels) in 2017/18 with a 5 percent increase in yield expected to offset a 1 percent decrease in planted area. French production is expected to increase 7.66 MMT (281 million bushels) year over year to 35.6 MMT (1.31 billion bushels) — a 33 percent improvement in yields. Precipitation across France is 25 percent below normal since March, however. The French crop bureau FranceAgriMer rated 68 percent of French soft wheat in good or excellent condition, down from 74 good to excellent percent the prior week. Dry conditions are also threatening yield potential in Austria, Germany, Italy and Poland. In Spain, drought conditions are expected to cut wheat production by 32 percent year over year to 4.72 MMT (173 million bushels). Additionally, the EU’s crop monitoring service MARS reduced its forecasts for wheat yields to 87.2 bu/acre (5.86 MT/ha), from 87.9 bu/acre (5.91 MT/ha) in May, but greater than the five-year average of 86.7 bu/acre (5.84 MT/ha). Weather forecasts for early July provide little relief for EU farmers, which could further threaten yield potential.

United States. USDA forecast U.S. 2017/18 wheat production at 49.6 MMT (1.82 billion bushels), down 21 percent year over year and 15 percent below the five-year average due to an anticipated 10 percent decline in average yield and the lowest number of planted acres since USDA records began in 1919. USDA expects the average yield to be (3.18 MT/ha) compared to the five-year average of (3.14 MT/ha). In the March 31 Prospective Plantings report, USDA reported U.S. farmers intended to plant 46.1 million acres (18.7 million hectares) of wheat for 2017/18.

USDA will update planted area estimates June 30. The first U.S. by-class estimates will be released in the July 12 World Agricultural Supply and Demand Estimates (WASDE) report.

Follow #wheatharvest17 on Twitter for the latest harvest photos and conditions.

Subscribe to USW Weekly Harvest Reports. To read the latest report, click here.

thumbnail

The 2017 wheat harvest is underway on the U.S. Plains and the High Plains Journal is spending another year following the custom harvesters. The “All Aboard Wheat Harvest” blog, sponsored by John Deere, enlists five correspondents to cover the harvest as the harvesters make their way from Texas to the Dakotas.

Keep up with the blog at https://allaboardharvest.com/ or sign up for daily emails from the crew on the site’s homepage. The correspondents will also be busy on social media:

Twitter: @AllAboardTour

Facebook: https://www.facebook.com/allaboardharvest

YouTube: https://www.youtube.com/user/AllAboardTour

Flickr: https://www.flickr.com/photos/allaboardtour

You can also follow the progress of the 2017/18 crop through the USW Harvest Report every Friday afternoon at https://www.uswheat.org/harvest.