By Claire Hutchins, USW Market Analyst
(Revised April 5, 2019)
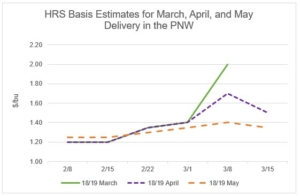
According to the March 29 USDA Prospective Plantings report, U.S. total spring-planted wheat area will fall to an estimated 14.2 million acres (5.75 million hectares), 7% below 2018/19, if realized. The estimate includes 12.4 million acres of hard red spring (HRS), down 2% from last year, if realized. USDA expects U.S. durum planted area to total 1.42 million acres (575,000 hectares), 25% below 2018/19 and 30% below the 5-year average. Farmers in the top four spring wheat producing states of North Dakota, Montana, South Dakota, and Minnesota are expected to decrease total spring wheat planted area year over year on price and weather concerns.
USDA expects a 150,000 acre (61,000 hectare) increase in North Dakota HRS area from 2018 to 6.7 million acres (2.71 million hectares), a 7% increase over the 5-year average, if realized. At the same time, USDA expects the state to decrease its planted durum area by 32% from last year. Currently, HRS commands a premium over durum at local elevators, prompting the decline in North Dakota’s durum planted area from 1.10 million acres (445,000 hectares) in 2018 to 750,000 acres (304,000 hectares) in 2019. Farmer frustration is evident in recent planting trends. In 2019, 11% of North Dakota spring wheat acres will go to durum compared to 23% in 2017.
Dr. Frayne Olson, crop economist and marketing specialist at North Dakota State University, told U.S. Wheat Associates (USW) the increase in HRS over durum planted area in the past few years is driven by the inversion in cash premiums for both classes.
“Four years ago, in 2015, farmers received $1.90 per bushel more for durum than HRS. And three years ago, in 2016, the durum premium over HRS was $1.20 per bushel,” Dr. Olson said. “Now, HRS commands a premium of between $0.12 per bushel to $0.41 per bushel premium over the top durum grade.”
USDA forecast Montana spring wheat planted area at 2.60 million acres (1.05 million hectares), down 10% from 2018/19. According to Cassidy Marn, marketing program manager with the Montana Wheat & Barley Committee, farmers are on track to begin planting by the third week in April, barring an unforeseen weather event, but are seeking more profitable alternatives to spring wheat. However, Marn added, more profitable choices are difficult to find because “the pulse market isn’t strong, and neither is the market for durum.” Mike Krueger, an independent market analyst based in North Dakota, suggests Montana farmers are more likely to leave would-be spring wheat acres fallow than to plant alternative crops like dry peas or barley.
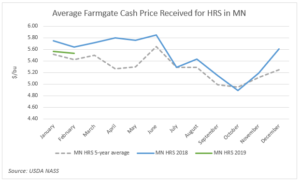
Minnesota HRS planted area is expected to decrease 5% from 2018/19 levels to 1.53 million acres (62,000 hectares). Krueger believes the state’s final area planted to HRS in 2019 will fall below the USDA’s estimate due to price and weather concerns.
“In the fall, there was a lot of enthusiasm for HRS because the initial 2019 CRC insurance price for spring wheat is $5.77. That compares to $6.31 a year ago,” Krueger said.
He believes Minnesota farmers will convert more 2019 spring wheat acres to soybeans because, despite trade disputes with China, the domestic soybean market is firmer on average than the markets for corn and wheat. Soybeans may be the most viable alternative if record precipitation keeps Minnesota farmers out of the fields for the next 20 to 30 days, forcing them out of the ideal spring wheat planting window.
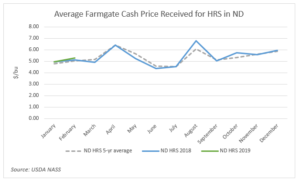
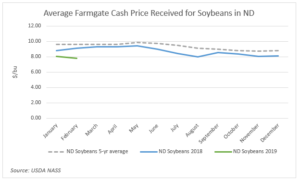
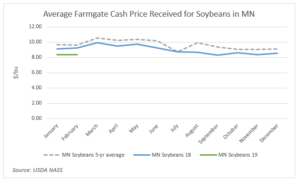
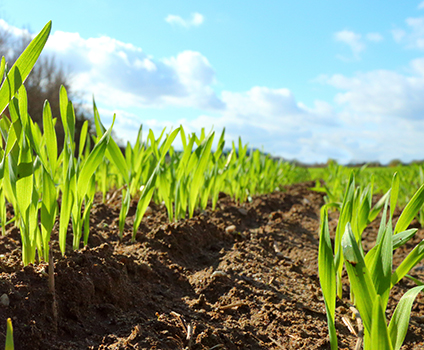
Competitive Soybeans. Comparing average and recent cash prices, relative stability can offer an incentive for farmers in North Dakota and Minnesota to plant more soybeans than spring wheat. This year, wet conditions could also favor more soybean planting.
South Dakota 2019/20 HRS planted area is forecast at 1.02 million acres (41,000 hectares), down 3% from last year. Reid Christopherson, executive director of the South Dakota Wheat Commission, said the USDA’s estimate may be a little optimistic given current weather and price conditions in the state. In the fall, producers were enthusiastic about converting harvested soybean acres to winter wheat, before extremely wet conditions delayed harvest and winter planting. Then, he said, hope for strong wheat markets persisted into the spring until the “bomb cyclone” hit the state, leaving many would be HRS acres buried under 30 to 43 cm. of snow. Now, he expects, spring wheat planting in South Dakota to be delayed until the third or fourth week in April. Christopherson said, “Late planting and low market prices will prompt producers to plant more row crops in 2019 than spring wheat, despite earlier intentions.”
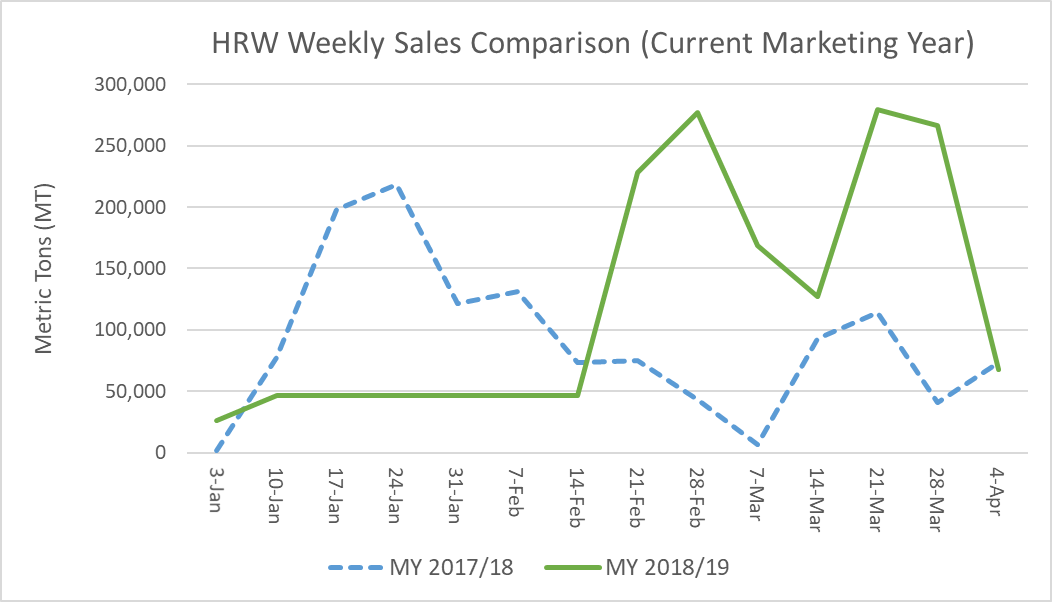
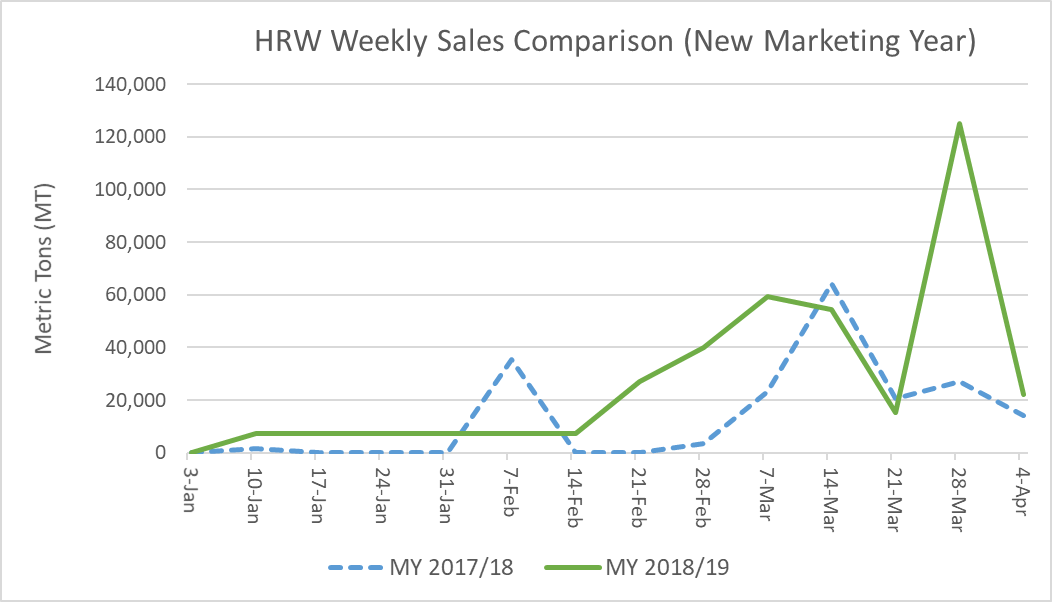
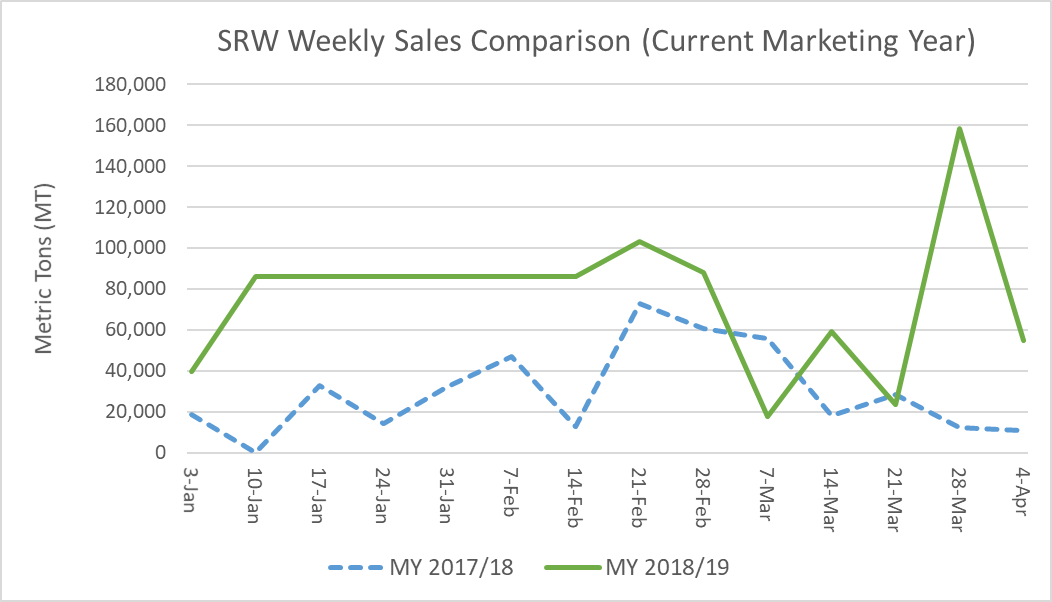
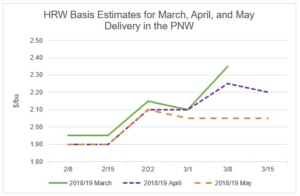
On April 1, USDA also updated the country’s winter wheat planted area from the February forecast. Total U.S. winter wheat area is now expected to hit 31.5 million acres (12.8 million hectares), up 200,000 acres (81,000 hectares) from the February forecast, but still 3% below the planted area for 2018/19 harvest. USDA now forecasts HRW planted area at 22.4 million acres (9.07 million hectares), up slightly from the previous projection, but still 3% below the year prior and 10% below the 5-year average on delayed planting. Soft red winter (SRW) planted area for 2019 harvest decreased from the previous estimate to 5.55 million acres (2.25 million hectares), 5% below 2018/19 planted area. The first USDA Crop Progress report of 2019, released April 1, indicated 56% of the country’s winter wheat to be in good to excellent condition.
USDA expects white wheat acres, planted in both winter and spring, to fall to 3.9 million acres (1.57 million hectares) for 2019/20, down 5% from 2018/19 and the 5-year average of 4.1 million acres (1.66 million hectares). The U.S. Drought Monitor shows adequate moisture for wheat-growing regions clustered in northeastern Oregon, southeastern Washington and north-central Idaho. However, central Washington and Oregon are experiencing abnormally dry to moderate drought conditions. Still, USDA reported that the majority of the white wheat crop in those three states is in good to excellent condition.
Planted area reductions for all classes bring the total wheat planted area for 2019 harvest down to 45.8 million acres (18.5 million hectares), 4% below 2018 and 7% below the 5-year average, making this year’s total wheat planted area the lowest since USDA records began in 1919.