Growing conditions over most of the U.S. hard red spring (HRS) wheat production area helped produce a 2018 crop with many positive features for buyers. There is greater supply of high-grade HRS with above average protein levels and very good dough and bake qualities. In general, many quality features are balanced across the region with some variation in grade factors, DON and dough strength.
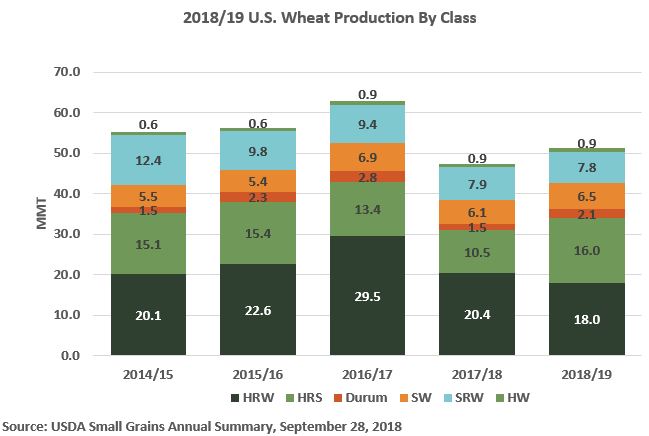
At an estimated 16.0 million metric tons (MMT), this is the largest HRS crop in 22 years and up significantly from 2017 with higher planted area and a record national average yield.
Here is a summary of the season and test results, with full data available online soon and in upcoming USW Crop Quality Seminars. As always, U.S. Wheat Associates (USW) reminds buyers to be diligent with contract specifications to ensure they receive the quality they need.
Weather and Harvest: Planting began in late April, later than normal, and continued to be slow until mid-May. Most of the crop was planted by early June. Then rain established a robust stand and good early growth. Drier conditions later in the season accelerated maturity and harvest started in late July; most of the crop was harvested by mid-September.
Wheat and Grade Data: The average grade is a U.S. No. 1 Dark Northern Spring (DNS), up from U.S. No. 1 Northern Spring (NS) in 2017. The overall average test weight is 62.2 lb/bu (81.7 kg/hl), higher than in 2017 and the 5-year average. Average damage is 0.3 percent, up from 2017, and shrunken and broken kernels average is 1.0 percent, similar to 2017. The crop shows excellent kernel color with average vitreous kernel content (DHV) of 87 percent compared to 71 percent for the 5-year average. Average DHV is 90 percent for Western samples and 84 percent for Eastern.
The average protein is 14.5 percent (12 percent mb), similar to 2017. Western average protein is 14.6 percent, down slightly from 2017, while Eastern average protein held steady at 14.4 percent.
Disease pressures were higher than in 2017. The overall DON average is 0.3 ppm, ranging from 0.0 to 0.2 ppm for Western composites and from 0.5 to 0.7 ppm for Eastern composites. Thousand kernel weight (TKW) is slightly higher than 2017 at 31.1 grams. A dry harvest period supported a high average falling number of 399 sec, indicating sound wheat.
Flour, Dough and Baking Data: Buhler laboratory mill flour yield averages 67.8 percent, down 3.5 percent from 2017, but similar to the 5-year average. Flour ash fell to 0.52 percent, compared to 0.58 percent a year ago. Wet gluten averages 35.3 percent. Amylograph values average 635 BU for 65 g of flour, up notably from 2017 and the 5-year average.
Farinograph dough tests indicate slightly higher absorption than last year with the Western region average at 65.2 percent and Eastern at 63.0 percent. The average farinograph stability is 10.8 min, similar to 2017 and the 5-year average. The Eastern crop has slightly stronger dough properties compared to the Western, but dough strength increases at higher protein levels in both regions.
Alveograph and extensograph analyses show more resistance and less extensibility. The average alveograph P/L ratio is 0.61 compared to 0.72 in 2017, and the W value is 415 (10-4 J) compared to 360 in 2017. The overall extensibility and resistance to extension of the 135 min extensograph are 13.2 cm and 855 BU compared to 2017 crop values of 13.5 and 770.
The average loaf volume is 973 cc, up marginally from 968 in 2017 with Western volumes down slightly but Eastern volumes higher. Average bake absorption is 69.6 percent, up sharply from both last year and the 5-year average. Bread scores are slightly lower in both Western and Eastern crops compared to 2017.