By Claire Hutchins, USW Market Analyst
Due to the U.S. government shutdown, the U.S. Wheat Associates (USW) mid-year report on 2018/19 export sales reflects USDA export sales data through Dec. 13, 2018. Year over year comparisons are drawn from USDA data on Dec. 14, 2017. Though not current, the data still provides valuable insight into U.S. wheat export conditions as of late last year.
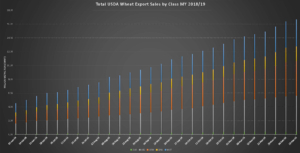
USDA continues to predict 2018/19 exports will reach 27.2 million metric tons (MMT), which, if realized, would be 11 percent higher than 2017/18 and 9 percent above the 5-year average. Total U.S. sales through the second half of the marketing year would have to reach 10.5 MMT to meet that estimate. USW expects the high quality and competitive pricing for select U.S. wheat classes will help push up the sales pace in the second half of the marketing year. Sales of soft red winter (SRW), hard red spring (HRS), and durum are all up year over year, while hard red winter (HRW) and soft white (SW) are behind last year’s pace.
Hard Red Winter (HRW)
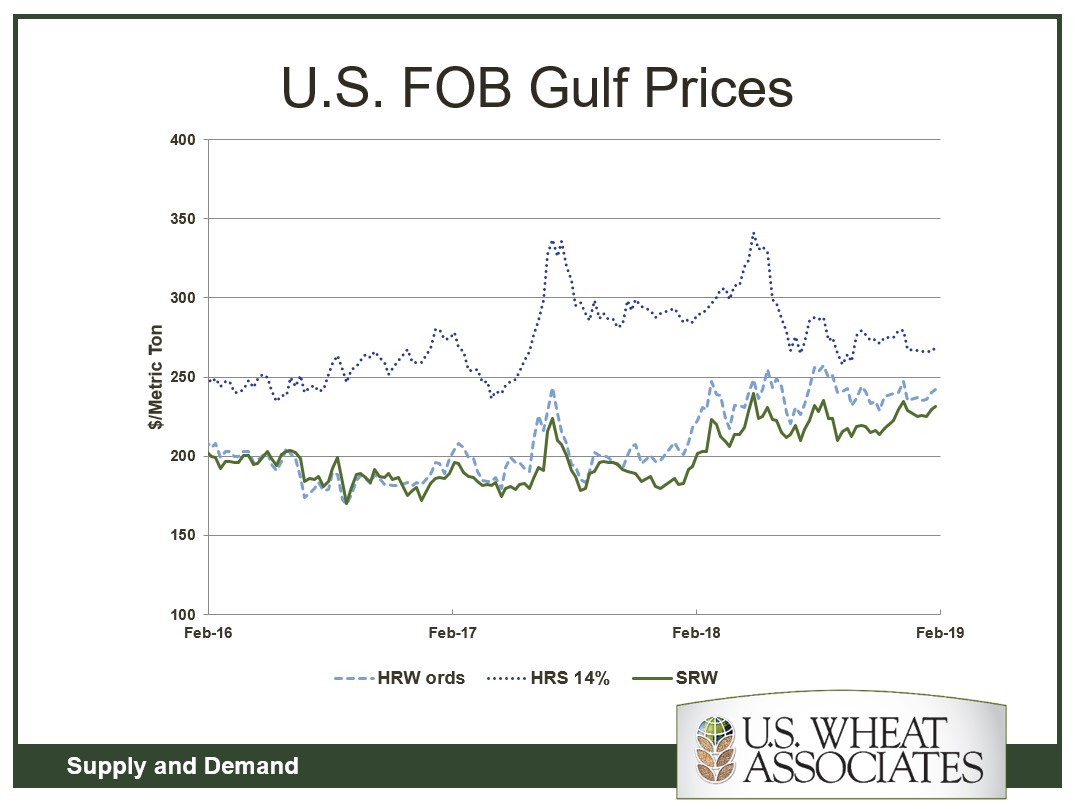
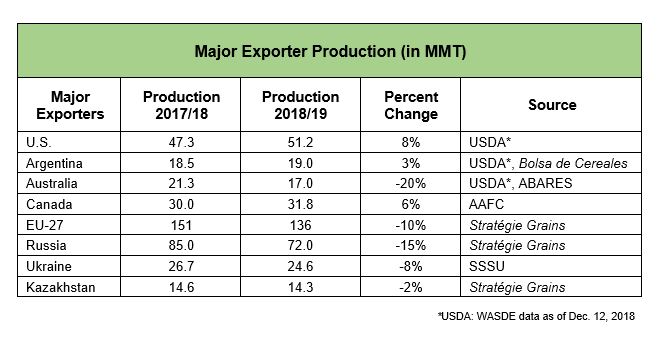
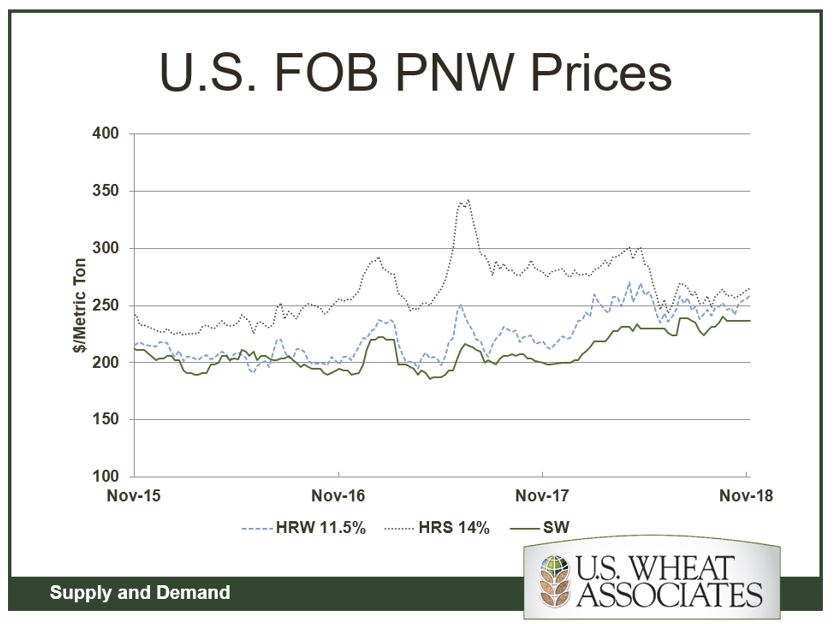
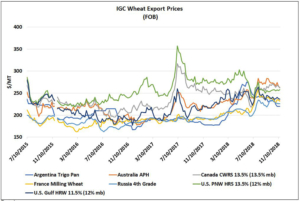
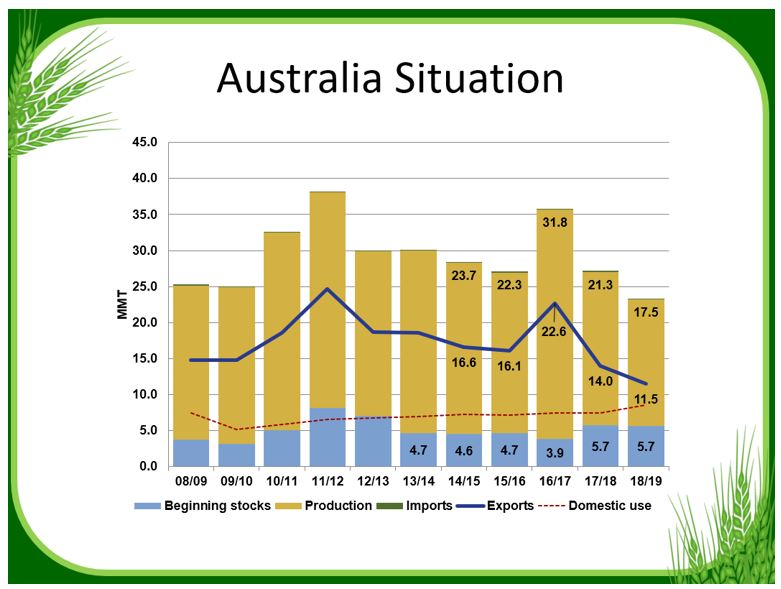
USDA reports HRW year-to-date exports at 5 MMT, down 33 percent from Dec. 14, 2017. Export sales to Mexico dropped 14 percent year over year to 1.27 MMT, which USW believes can be attributed to a rocky trade relationship. In 2018, Russia produced its third largest crop of wheat. The significant volume of Russian Third Class held a firm FOB price advantage over U.S. HRW in the first half of the marketing year. Competition for HRW remains stiff in the price-conscious markets where Russia has a freight advantage, but the spread between Russian Third Class and U.S. HRW FOB prices has narrowed significantly since June 2018, a price convergence that could boost HRW demand. The 2018 HRW crop quality attributes significantly exceed the last two years and many of the 5-year averages, indicating that this is one of the highest quality HRW harvests in several years.
Hard Red Spring (HRS)
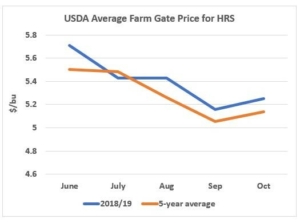
Total HRS sales of 5.2 MMT are up 4 percent from this time last year and fall right in line with the 5-year average. The HRS harvest was the largest in 22 years and boasts above average protein levels and excellent dough and bake qualities. That quality and competitive pricing* drive export demand as FOB prices out of the Pacific Northwest remain near a constant $255 per MT. The Philippines continues to import the largest volume of HRS at 1.4 MMT, which marks a 24 percent increase over last year’s pace. Sales to Vietnam are up significantly year over year to 132,000 MT, and sales to Thailand are up 50 percent at 338,000 MT. Only the tariff conflict with China, which has imported no U.S. wheat since March 2018, holds back current HRW sales.
*From November 17, 2017, to Nov. 18, 2018, U.S. HRS FOB prices declined nearly 20 cents per MT while competitor prices over the same period trended slightly higher.
Soft Red Winter (SRW)
Export sales of SRW through Dec. 13, 2018, are up 15 percent over 2017/18 at 2.15 MMT, driven by competitive SRW FOB prices. Sales to nine of the top 20 U.S. SRW export markets, including Brazil, Costa Rica and South Africa, are ahead of last year’s pace. Sales to Mexico are 10 percent ahead of 2017/18 at 605,000 metric tons (MT). Ecuador’s SRW imports stand at 147,000 MT, up substantially from last year.
Soft White (SW)
As of Dec. 13, 2018, export sales of SW are down 8 percent year over year at 3.9 MMT. However, total sales rise above the 5-year average by 20 percent. The loss of Chinese SW imports points to the drop in export sales year over year. The Philippines and Indonesia, two of our SW top markets, hold steady at 911,000 MT and 507,000 MT, respectively, compared to the 2017/18 pace. Sales to Yemen are 18 percent ahead of last year’s pace at 181,000 MT and sales to Thailand are 46 percent ahead of last year’s pace at 283,000 MT. SW customers are taking advantage of this year’s good test weight, lower moisture and lower protein content.
Durum
Year to date durum exports total 406, 000 MT, up 50 percent from Dec. 14 last year with increased import paces in all U.S. durum markets. Most notably, export sales to the European Union, already the largest buyer of U.S. durum, increased by 101 percent to 232,000 MT, supported by the crop’s excellent quality and competitive price. The 2018 harvest boasts high protein and excellent kernel characteristics, ideal for premium pasta products.
Hard White (HW)
USDA reports notable HW sales of 135,000 MT to Nigeria. This is the first significant export sales of HW in many years, as HW production is up slightly from the year prior and boasts high protein levels and good bread baking potential.
Looking Ahead
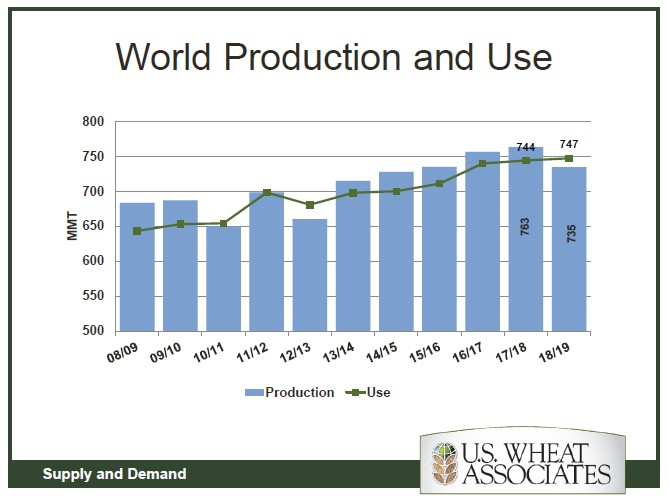
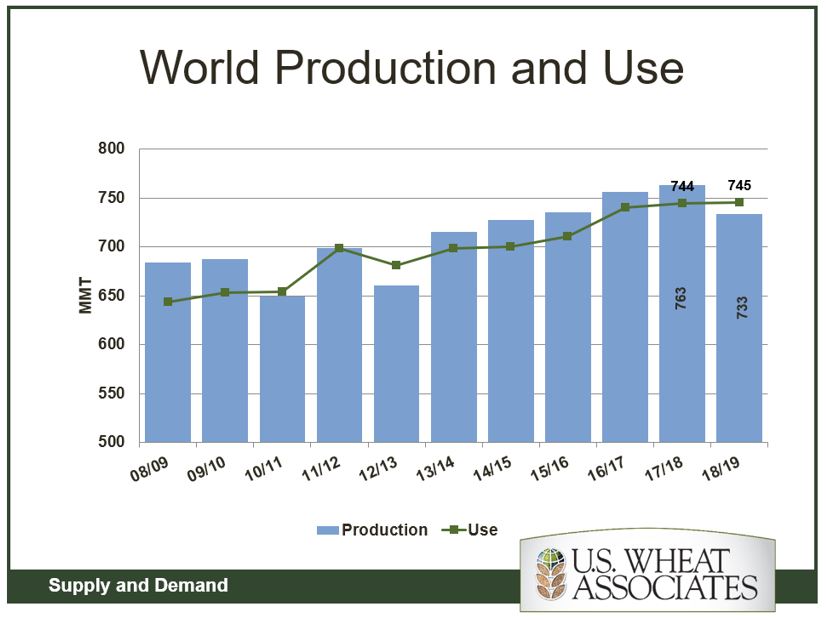
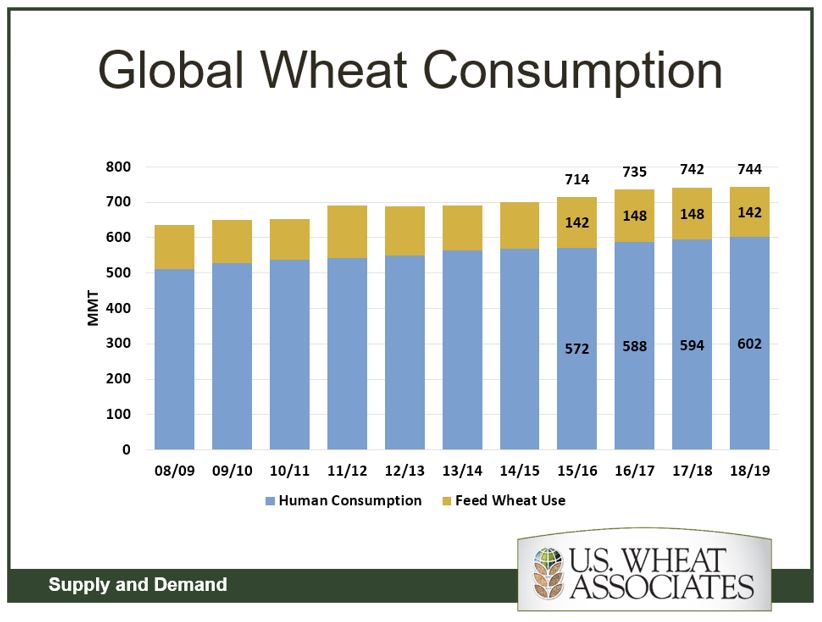
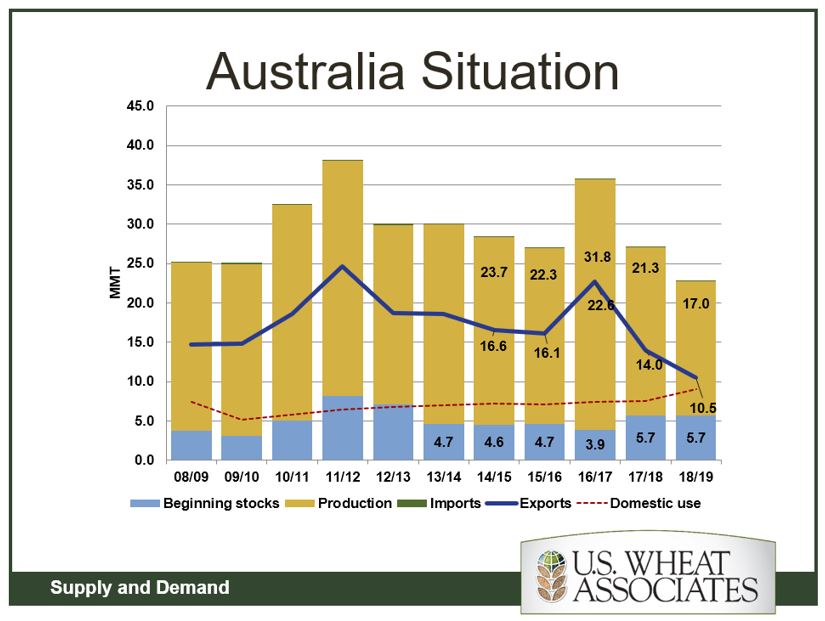
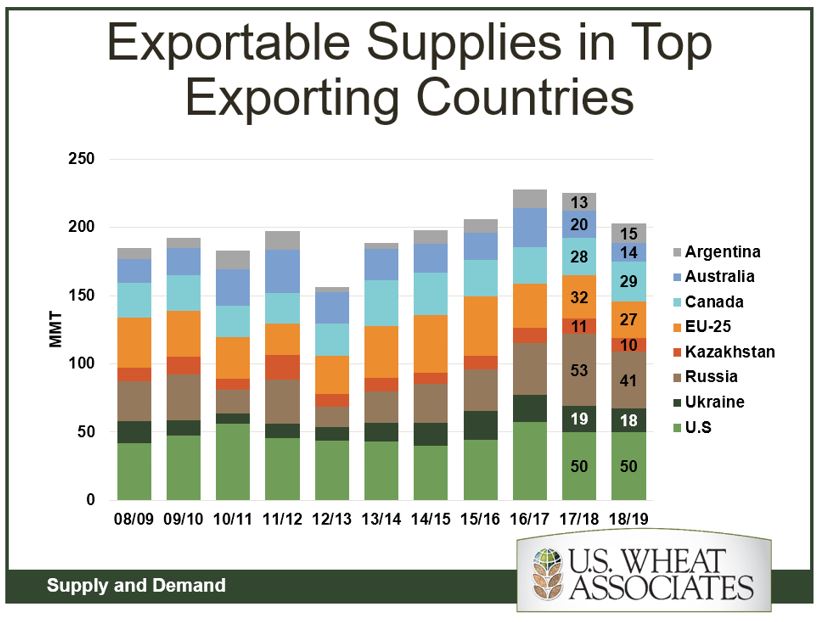
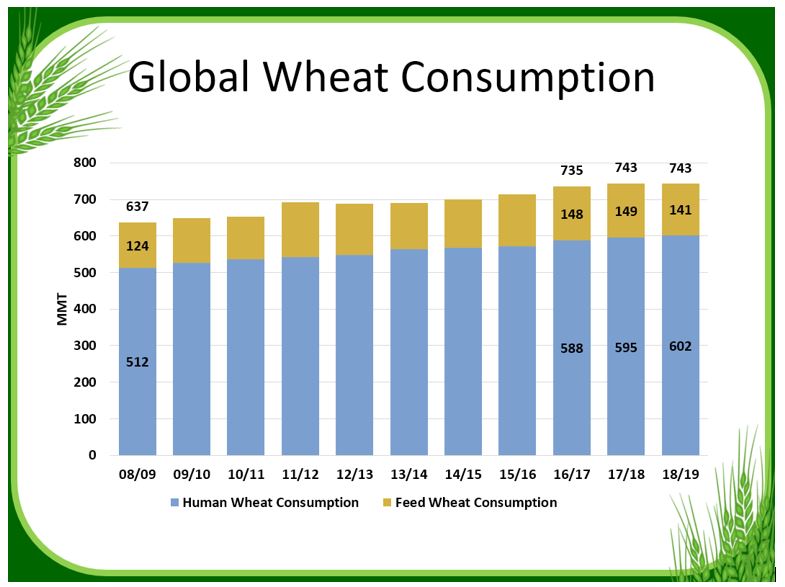
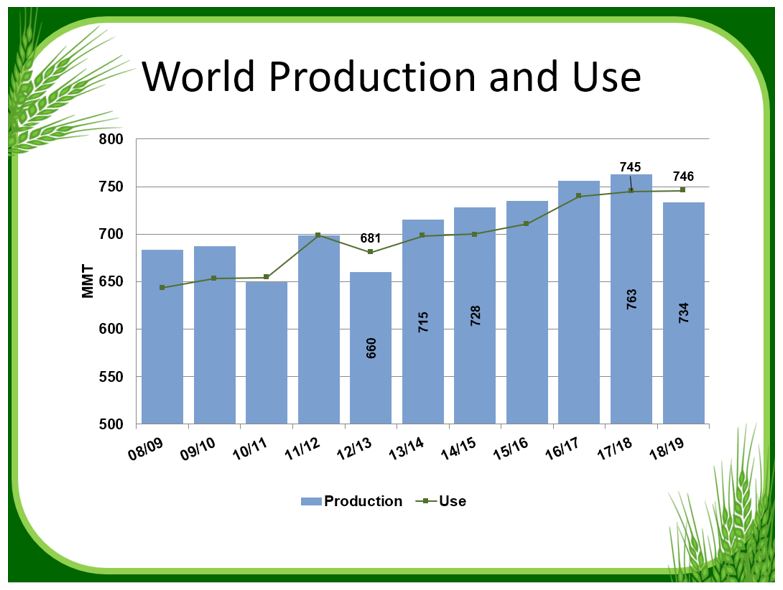
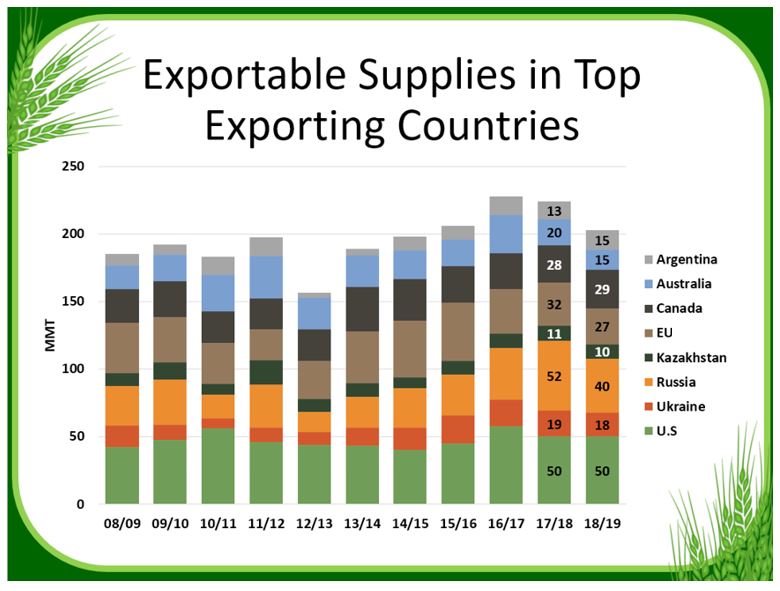
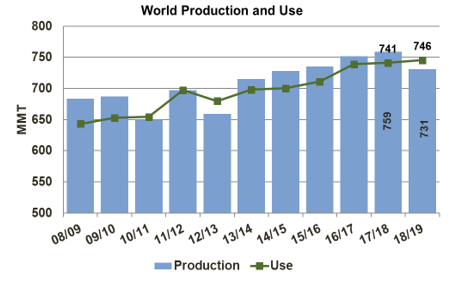
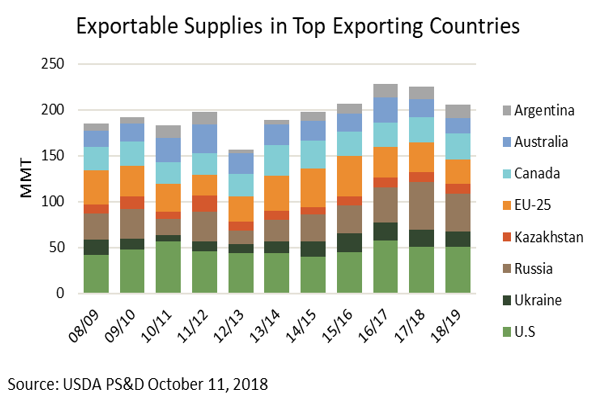
USDA projects a 4 percent increase in global wheat consumption over the 5-year average at 744 MMT. As exportable supplies from Russia, the EU and Australia begin to wane as we move into the second half of the marketing year, U.S. FOB prices for HRW, SRW, and HRS are more competitive now than they were in June 2018. This represents an advantageous opportunity for customers to extract even more value from the 2018/19 U.S. wheat supply.