By Claire Hutchins, USW Market Analyst
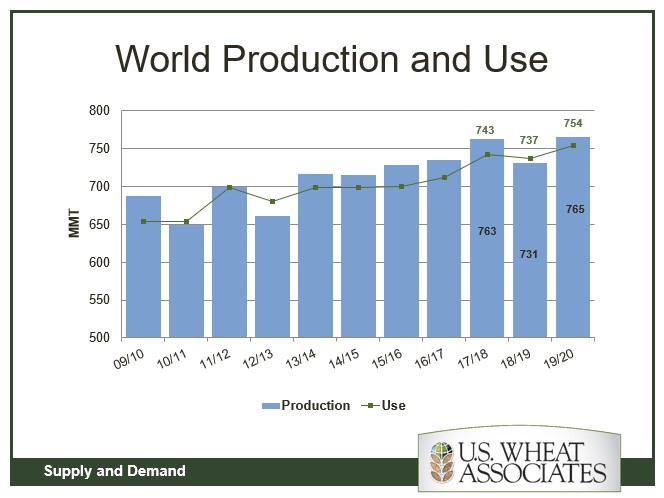
With six months gone in marketing year 2019/20, USDA currently believes total U.S. wheat exports will reach 26.5 million metric tons (MMT), which, if realized, would be 4 percent more than 2018/19 and 7 percent more than the 5-year average. U.S. Wheat Associates (USW) believes the high quality and competitive pricing for select U.S. wheat classes and other factors definitely support USDA’s estimate.
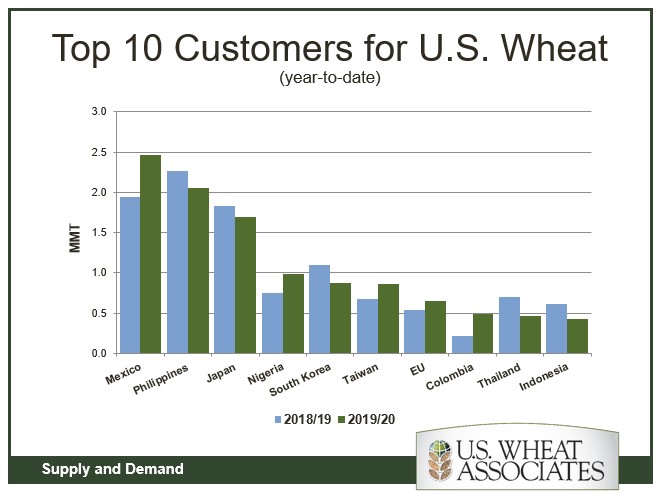
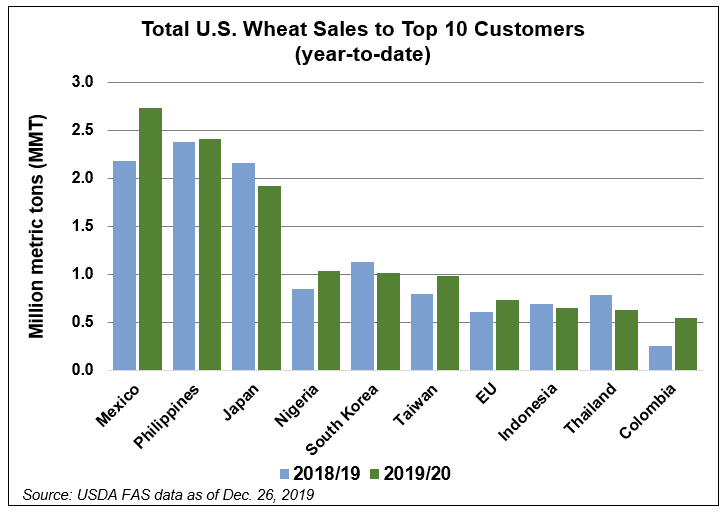
As of Dec. 26, 2019, total commercial sales of 18.5 MMT already make up 71% of USDA’s latest export forecast. Commercial sales to 11 of the top 20 markets for U.S. wheat are ahead of last year’s pace and total export sales to all destinations are 6 percent ahead of sales on the same date in 2018/19.
Hard Red Winter (HRW)
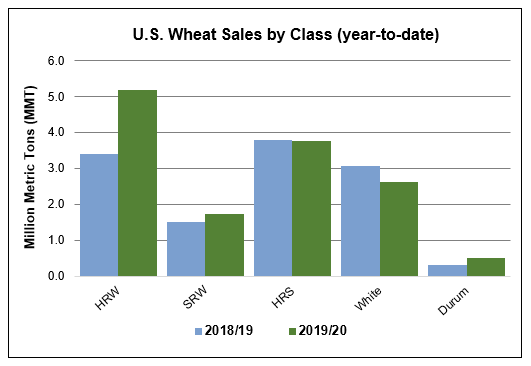
USDA expects the United States to export 10.6 MMT of HRW in 2019/20, 18 percent more than 2018/19, if realized. Year-to-date HRW sales total 6.91 MMT, 24 percent ahead of last year’s pace and 65 percent of USDA’s total estimate. Exports to three of the top five HRW export markets are significantly ahead of last year’s pace. Sales to Mexico, the largest market for HRW, are 30 percent ahead of last year at 1.80 MMT. Exports to Nigeria are 19 percent ahead of last year at 580,000 metric tons (MT) and sales to Taiwan are 41 percent ahead of last year’s pace at 333,000 MT. USW believes HRW sales could continue to grow through the second half of 2019/20 assuming U.S. HRW prices remain competitive at the global level. According to AgriCensus data, on Dec. 30, 2019, U.S. HRW 11.0 percent (on a 12 percent moisture basis) prices off the Gulf was $222 per MT FOB and comparable Russian 12.5 percent protein wheat (on a dry moisture basis) was $3 per MT less at $219 per MT FOB.
Hard Red Spring (HRS)
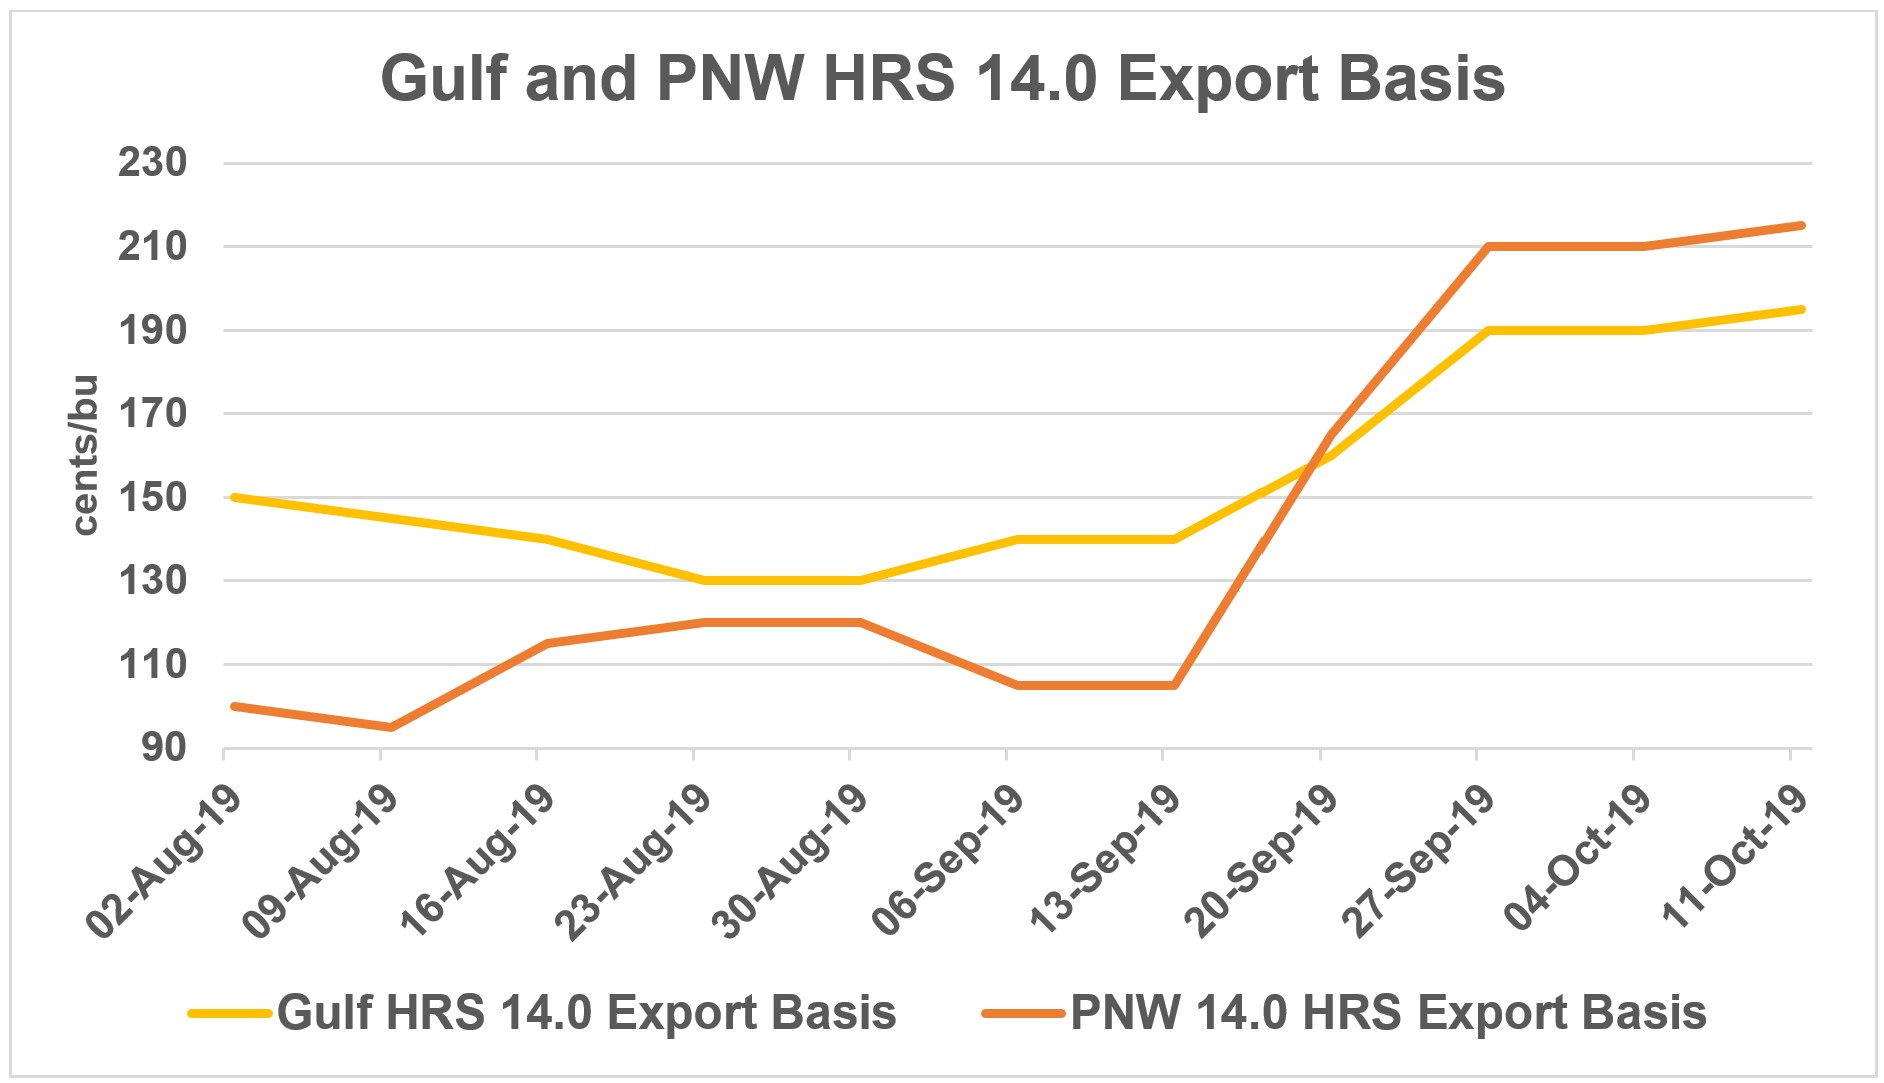
USDA forecasts 2019/20 HRS exports will reach 7.10 MMT, in line with last year despite the significant effects of an overly wet harvest. USDA even increased its total HRS export estimate 2 percent between October and November 2019 from 6.94 MMT to 7.10 MMT. Year-to-date total HRS sales of 5.3 MMT are down 4 percent from 2018/19 and fall 7 percent less than the 5-year average. USW believes slower export sales could be attributed to HRS FOB prices between September and December 2019 that were higher than last year at the same time.1 Between late September and late December 2018, the average nearby FOB price for HRS off the Pacific Northwest (PNW) was $259 per MT. Between late September and late December 2019, the average nearby FOB price for HRS out of the PNW was $271 per MT, 5 percent more than the same period last year. Yet year-to-date exports to the top two importers of HRS are only slightly behind last year’s pace. Exports to Japan and Korea, top 5 importers of HRS, are both ahead of last year’s pace at 514,000 MT and 362,000 MT, respectively.
1Source: USW Price Report.
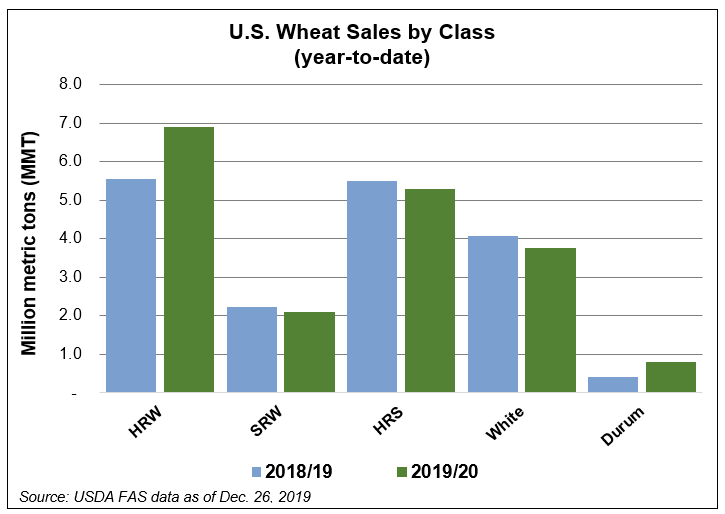
Soft Red Winter (SRW)
Export sales of 2.10 MMT for SRW through Dec. 26, 2019, are 6 percent less than 2018/19. This difference relates mainly to increased SRW export prices due to a significant decline in exportable supplies. USDA predicts 2019/20 SRW ending stocks will fall to 3.02 MMT, 30 percent less than 2018/19, if realized. USDA forecasts total SRW exports will fall 22 percent year-over-year to 2.72 MMT. Year-to-date commercial sales of SRW to all destinations make up 77 percent of USDA’s total SRW export estimate. Despite lower production and higher prices, SRW sales to five of the top ten export markets are ahead of last year’s pace. Exports to Mexico, the top destination for SRW, total 641,000 MT, up 2 percent from last year. Sales to Colombia and Nigeria, both top 5 export markets for SRW, are up 38 percent and 20 percent from last year, respectively. Imports by Brazil are also running at a faster pace so far this marketing year.
White Wheat (Soft and Hard2)
USDA predicts “white wheat” exports (which includes 99.7 percent soft white) will fall 3 percent in 2019/20 to 5.20 MMT. As of Dec. 26, 2019, export sales of white wheat at 3.77 MMT are 8 percent behind last year’s pace and make up 73 percent of USDA’s final export estimate. The sales pace on the same date for four of the five top white wheat export markets is less than last year. According to industry experts, routine demand from these top markets is lagging in part because some importers believed FOB prices were too high throughout the first half of 2019/20. Some price sensitive buyers in Southeast Asia were focused on relatively low-cost Black Sea supplies. However, export sales to the Philippines, the top market for white wheat, are 9 percent ahead of last year’s pace at 1.0 MMT. USW believes routine demand from top buyers may pick up again in the second half of 2019/20 as Black Sea exportable supplies dwindle before harvest and U.S. white wheat prices grow more competitive with the shortage of Australian white classes.
2USDA sales reports combine SW and hard white (HW) export sales.
Durum
Year-to-date U.S. durum exports total 790,000 MT, which is significantly ahead of the same time last year. Despite significantly lower production, between October and November 2019 USDA increased its 2019/20 U.S. durum export forecast by 40 percent from 680,000 MT to 950,000 MT. Italy and other European Union (EU) countries are significant U.S. durum importers. Demand appears to be up in 2019/20 because EU durum production was 12 percent less than last year. As of Dec. 26, 2019, U.S. durum exports to Italy are more than double last year’s pace at 462,000 MT.