thumbnail

By Claire Hutchins, USW Market Analyst

It is no secret that these are uncertain times. As countries across the world work to contain and combat the novel coronavirus (COVID-19) outbreak, U.S. Wheat Associates (USW) is closely monitoring the effects of the outbreak on global wheat trade dynamics. According to a host of U.S. grain traders, it is too soon to tell the immediate effects of the pandemic on the international demand for U.S. wheat.

However, there is a clear relationship between the turbulence in global economic markets and the export price of U.S. wheat. Over the past several months, the export price for all classes of wheat out of the Gulf and Pacific Northwest (PNW) has fallen due to substantial pressure in the U.S. wheat futures markets, pressure that the pandemic has only increased.

Between late January and mid-March 2020, nearby Chicago Board of Trade (CBOT) soft red winter (SRW) wheat futures fell 12% from $5.74/bu to $5.06/bu. Nearby Kansas City Board of Trade (KCBT) hard red winter (HRW) wheat futures fell 11% from $4.86/bu to $4.32/bu. Nearby Minneapolis Grain Exchange (MGEX) hard red spring (HRS) wheat futures fell 7% from $5.48/bu to $5.08/bu.

During the same period, PNW HRW 11.5% protein (on a 12% moisture basis) FOB prices fell 7% from $241/MT to $224/MT. Gulf HRW 11.5% protein FOB prices fell 9% from $235/MT to $214/MT and Gulf SRW FOB prices fell 13% from $262/MT to $228/MT.

Gulf HRS 14% protein FOB prices fell $16/MT from $267/MT to $251/MT and PNW HRS 14% protein FOB prices fell $12/MT from $263/MT to $251/MT.

Under these unprecedented circumstances, USW is doing everything it can to continue to promote the reliability, quality and value of all six U.S. wheat classes to our overseas customers. USW encourages our customers and stakeholders to reach out to our colleagues by telephone or email. We are ready to provide the information our customers need about U.S. wheat supplies or market factors, or answer any marketing and processing questions that may arise.

thumbnail

By Claire Hutchins, USW Market Analyst

Navigating U.S. export markets and making purchasing decisions is a complicated, risk-involved process, especially when wheat customers have so many options for sourcing their supplies. As representatives of the U.S. wheat industry, U.S. Wheat Associates (USW) recognizes it has a social contract to ensure our customers have access to accurate, unbiased price information to help them make timely buying decisions.

One of the ways USW has done that over many decades is by publishing a weekly Price Report on Friday afternoon that gives the world’s buyers an independently derived baseline of export prices for U.S. wheat by class, protein level, export region and delivery month. This report provides an independent assessment of weekly export prices across a broad segmentation of the U.S. wheat sector and delivers independent estimates of export basis and export prices based on industry surveys.

USW recently launched new Price Charting Tools based on Price Report data to help overseas customers visualize current and historic U.S. wheat FOB prices and export basis values by export region, class, protein level and date. The Price Charting Tools, found on the USW website, also feature wheat futures prices by date and grain exchange. Customers can also chart FOB and basis spreads between different classes, protein levels and export regions.

“The new charting tools are valuable resources for overseas buyers to view historical price trends of four of the six wheat classes produced in the United States,” says Mike Spier, USW Vice President of Overseas Operations. “USW’s new charting tools will give buyers valuable insight by showing them how past changes in the U.S. and world wheat supply and demand situation influenced U.S. wheat prices.”

These new graphing tools link users to the most detailed, public database of historic U.S. wheat FOB and export basis levels.

“Not only can users look back at historical market behavior as one clue toward looking to and anticipating future action, but they can also look at a breadth of historical value relationships including intra wheat class relationships and winter wheat class protein level spreads,” says USW President Vince Peterson. “This is one exceptional tool for wheat buyers that are trying to analyze and select the value proposition best offered and delivered by the various U.S. wheat classes.”

To access USW’s new Price Charting Tools directly, click here. To access the Price Charting Tools from anywhere on the USW website, click “Price Charting Tools” under the Market and Crop Information menu at the top of the page. For more information on the USW Price Report, click here.

thumbnail

By USW Market Analyst Claire Hutchins

Between January and February 2020, USDA raised its total U.S. wheat export estimate from 26.5 million metric tons (MMT) to 27.2 MMT, 7% greater than last year, if realized. U.S. Wheat Associates (USW) believes the United States is on track to reach USDA’s export estimates due to favorable marketing trends in the first half of 2019/20 that led to a strong export pace between June 2019 and February 2020.

U.S. wheat farmers continue to produce an abundant supply of high-quality wheat, which is always a factor in overseas demand. Export prices have certainly attracted customers’ attention in marketing year 2019/20. And if they compare current price trends to what has happened at this time of year on average the past five years, customers can also see an unusual buying opportunity.

HRW. USDA expects 2019/20 HRW exports will reach 10.6 MMT, 18 percent greater than last year, if realized. Relatively low HRW prices during the first half of 2019/20 boosted HRW exports into early 2020. Between early June 2019 and late December 2020, the average Gulf HRW 11.5% protein (on a 12% moisture basis) FOB price trended about 7 percent below the 5-year average price. As of Feb 13. 2020, HRW exports to all destinations total 6.44 MMT, 33 percent greater than this time last year and 61 percent of USDA’s 2019/20 forecast. HRW prices climbed between late August and early January but have fallen back 4 percent between to $226/MT FOB, offering a price incentive for the final months of the marketing year.

HRS. USDA forecasts 2019/20 HRS exports will reach 7.48 MMT, 6 percent greater than last year, if realized. As of Feb 13. 2020, HRS exports to all destinations total 4.62 MMT, slightly below last year and 62 percent of USDA’s 2019/20 forecast. Gulf HRS 14% protein prices trended dramatically below 2018 values and the 5-year average price between early June and late September, until concerns of a wet harvest brought prices more in line with 2018 levels at about $270/MT. However, HRS prices are trending down in the second half of 2019/20 and are, on average, 5 percent lower than the 5-year average FOB trendline at about $264/MT. Industry experts believe HRS FOB prices could continue their downward trend on cheaper nearby secondary rail rates and light export demand, beneficial for deliveries in April and May 2020.

SRW. USDA predicts SRW exports will total 2.72 MMT, 22 percent lower than last year, if realized. USW reported Feb. 5, soft red winter (SRW) export prices had been climbing steadily since the end of the 2019 harvest on reduced production, tight ending stocks and stable domestic and overseas demand. However, after Jan. 24, a dip in export demand pressured prices, offering an opportunity for SRW importers to lock in a lower price through the end of marketing year 2019/20. Between Jan. 24 and Feb.14, 2020, SRW prices fell 6 percent to $247/MT FOB. Despite reduced production and higher than average prices, SRW exports to date are in line with this time last year at 1.83 MMT, 67 percent of USDA’s final forecast.

White wheat (soft and hard). USDA predicts 2019/20 white wheat exports will total 5.31 MMT, in line with last year and 15 percent greater than the 5-year average of 4.60 MMT. For the majority of the first half of 2019/20, soft white (SW) wheat (representing 99 percent of U.S. white wheat production) 10.5% maximum protein prices trended well below the last year’s price and the 5-year average price over the same time period, providing overseas customers with ideal white wheat buying opportunities. As of Feb. 14, the SW 10.5% protein maximum FOB price was $237/MT, 2 percent lower than this time last year and 5 percent below the 5-year average. As of Feb. 13, 2020, all white wheat exports total 3.56 MMT, 3 percent greater than last year and 67 percent of USDA’s final white wheat export forecast.

Durum. USDA predicts 2019/20 U.S. durum exports will total 1.10 MMT, 83 percent greater than last year and 54 percent greater than the 5-year average. Durum exports to Italy, the largest market for U.S. durum, are more than double what they were this time last year at 439,000 metric tons (MT) due to a 12 percent reduction in European Union (EU) durum production in 2019. Year-to-date U.S. durum exports now total 655,000 MT, nearly double last year’s export pace and 60 percent of USDA total 2019/20 durum export forecast.

thumbnail

By Claire Hutchins, USW Market Analyst

Soft red winter (SRW) export prices had been climbing steadily since the end of the 2019 harvest on reduced production, tight ending stocks and stable domestic and overseas demand. Then after Jan. 24, 2020, export basis and FOB prices dipped, offering an opportunity for SRW importers to lock in a lower price through the end of marketing year 2019/20.

From mid-July 2019 to mid-January 2020, SRW export basis rose 65 percent from $0.85 per bushel (/bu) to $1.40/bu, 33 percent higher than last year at this time and 47 percent higher than the 5-year average.

However, between Jan. 24 and Jan. 31, 2020, a dip in export demand pressured SRW export basis for the first time since early September. SRW export basis fell 7 percent to $1.30/bu, the lowest since early December 2019. Lower basis and softer futures prices also pressured SRW FOB values 4 percent between Jan. 24 and Jan. 31 from $262/MT to $251/MT.

Market watchers, including those at U.S. Wheat Associates (USW), believe this price decline is a good buying signal. They believe SRW export basis will remain high through the end of 2019/20 based on still tightening exportable supplies and stable demand from overseas customers. Members from the grain trade also believe SRW export basis will be higher than average through the 2020/21 harvest based on significantly reduced beginning stocks year-over-year and substantial reductions in SRW planted area in states tributary to the Mississippi River, where a significant amount of SRW is transported from the countryside to export facilities in the Gulf.

Specifically, farmers reduced SRW planted area for harvest in 2019 due to overly wet field fields in the fall of 2018 and unprofitable prices. SRW production fell 17 percent from last year to 6.50 million metric tons (MMT), the lowest since 2010/11. USDA expects SRW ending stocks at the end of 2019/20 to fall 49 percent to 2.88 MMT, the lowest in 10 years. USDA predicts SRW exports will total 2.72 MMT, in line with the 5-year average.

thumbnail

By Claire Hutchins, USW Market Analyst

With winter wheat prices remaining at or less than the cost of production and with a very wet planting season, it is no surprise that many U.S. farmers chose to plant slightly less winter wheat for harvest in 2020. USDA’s 2020/21 Winter Wheat Seedings report, released Jan. 10, reported U.S. farmers planted 30.8 million acres (12.5 million hectares) of winter wheat, down slightly from 2019/20 and 7% less than the 5-year average of 33.2 million acres (13.4 million hectares). Decreases for HRW and white winter wheat more than offset an increase in SRW planted area. USDA noted that this is the second smallest number of winter wheat acres on record.

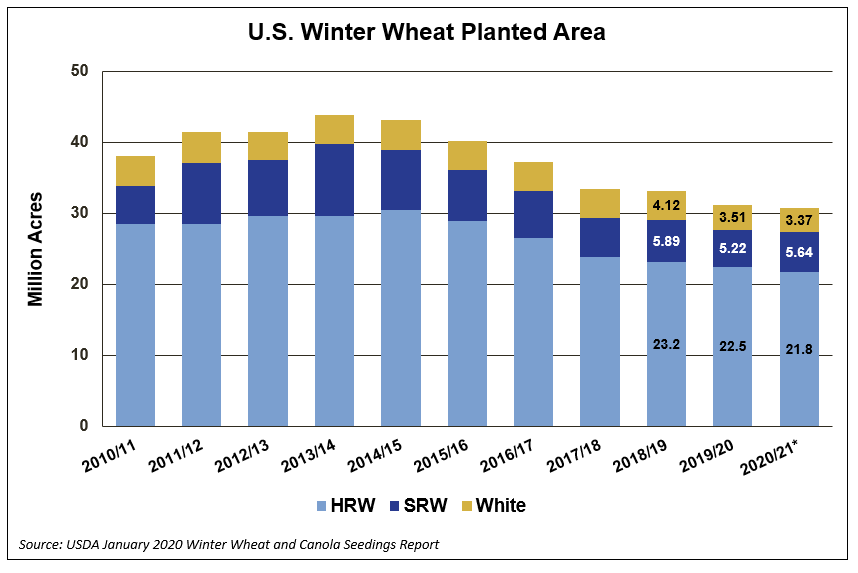
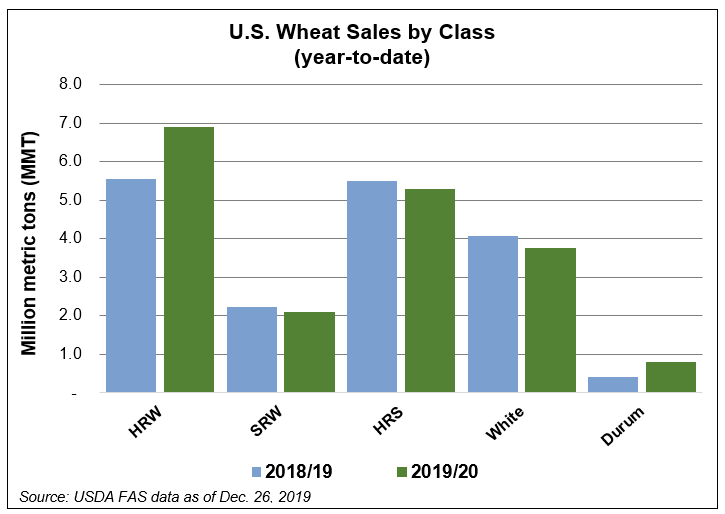
Hard red winter (HRW). USDA assessed HRW planted area at 21.8 million acres (9.35 million hectares), down 1% from 2018. Planted acreage is down year-over-year in several major HRW-producing states with the largest decreases reported in Colorado, Montana and Nebraska. Colorado planted area fell 12% year-over-year to 1.90 million acres due to extreme dryness in the southeast, depressed commodity prices and pest pressure in the northeast. Record low planted area of 900,000 acres (364,000 hectares) in Nebraska can be attributed to weaker marketing conditions and an overly wet, late soybean harvest which prevented fall HRW planting.

“This didn’t just happen overnight,” says Royce Schaneman, executive director of the Nebraska Wheat Board. “State-wide plantings have been trending down for a number of years due to poor marketing conditions.”

HRW planted area in Kansas and Oklahoma is stable year-over-year at 6.90 million acres (2.79 million hectares) and 4.20 million acres (1.7 million hectares), respectively.

Total winter wheat planted area in Texas jumped 9% year-over-year to 4.90 million acres (1.94 million hectares). About 95% of Texas winter wheat is HRW and 5% is SRW.

“Adequate soil moisture in many regions, combined with favorable marketing conditions compared to cotton, allowed producers to maximize HRW acres,” says Darby Campsey, director of communications and producer relations for the Texas Wheat Producers Board.

In South Dakota, North Dakota, Montana and Wyoming, a very wet fall also prevented more HRW seeding, although these states usually plant a relatively small percentage of total U.S. HRW.

Soft red winter (SRW). Total SRW planted area of 5.64 million acres (2.28 million hectares) increased 8% from 2018. Increases in most SRW-producing states more than offset decreases in Delaware, Illinois Indiana, Michigan, Missouri and Wisconsin.

According to Tadd Nicholson, executive director of the Ohio Corn and Wheat Growers Association, the state’s SRW planted area increased 12% over last year to 560,000 acres (227,000 hectares) due to ideal, timely planting conditions following a miserably wet spring which left many corn and soybean acres unplanted.

In Illinois, SRW planted area fell 25% from last year to 490,000 acres (198,000 hectares).

“It was one of the craziest years for weather in Illinois,” says Mike Doherty, interim executive director of the Illinois Wheat Association “It was the third wettest year on record and most of the precipitation fell in the first eight months. Farmers were beside themselves trying to manage other crops through the wet weather. Across the state, corn and soybeans were harvested 30 to 60 days late. You just can’t plant winter wheat if you can’t get the other crops out of the ground.”

There is also SRW grown in areas of Texas and Campsey reports that “strong marketing opportunities and better, dryer planting conditions for SRW compared to last year’s overly wet field conditions led to a significant increase in SRW acreage year-over-year.”

White winter wheat. White winter wheat planted area fell to an estimated 3.37 million acres (1.36 million hectares), down 4% from 2018. White winter wheat planted area in Idaho, Oregon and Washington fell below last year. Idaho farmers reported planting 720,000 acres (291,000 hectares) compared to 730,000 acres (295,000 hectares) in 2018. Planted area in Oregon fell 5% from last year to 700,000 acres (283,000 hectares). Washington planted area fell slightly less than 2018 to 1.70 million acres (688,000 hectares).

Durum. Winter durum planting in the southwestern United States is estimated at 70,000 acres (28,300 hectares), up 9% from 2018 but 41% less than 2017. Arizona and California plant Desert Durum® from December through January for harvest May through July.

thumbnail

By Claire Hutchins, USW Market Analyst

With six months gone in marketing year 2019/20, USDA currently believes total U.S. wheat exports will reach 26.5 million metric tons (MMT), which, if realized, would be 4 percent more than 2018/19 and 7 percent more than the 5-year average. U.S. Wheat Associates (USW) believes the high quality and competitive pricing for select U.S. wheat classes and other factors definitely support USDA’s estimate.

As of Dec. 26, 2019, total commercial sales of 18.5 MMT already make up 71% of USDA’s latest export forecast. Commercial sales to 11 of the top 20 markets for U.S. wheat are ahead of last year’s pace and total export sales to all destinations are 6 percent ahead of sales on the same date in 2018/19.

Commercial Sales - U.S. wheat sales to Top 10 Customers - JAN20

Hard Red Winter (HRW)

USDA expects the United States to export 10.6 MMT of HRW in 2019/20, 18 percent more than 2018/19, if realized. Year-to-date HRW sales total 6.91 MMT, 24 percent ahead of last year’s pace and 65 percent of USDA’s total estimate. Exports to three of the top five HRW export markets are significantly ahead of last year’s pace. Sales to Mexico, the largest market for HRW, are 30 percent ahead of last year at 1.80 MMT. Exports to Nigeria are 19 percent ahead of last year at 580,000 metric tons (MT) and sales to Taiwan are 41 percent ahead of last year’s pace at 333,000 MT. USW believes HRW sales could continue to grow through the second half of 2019/20 assuming U.S. HRW prices remain competitive at the global level. According to AgriCensus data, on Dec. 30, 2019, U.S. HRW 11.0 percent (on a 12 percent moisture basis) prices off the Gulf was $222 per MT FOB and comparable Russian 12.5 percent protein wheat (on a dry moisture basis) was $3 per MT less at $219 per MT FOB.

Hard Red Spring (HRS)

USDA forecasts 2019/20 HRS exports will reach 7.10 MMT, in line with last year despite the significant effects of an overly wet harvest. USDA even increased its total HRS export estimate 2 percent between October and November 2019 from 6.94 MMT to 7.10 MMT. Year-to-date total HRS sales of 5.3 MMT are down 4 percent from 2018/19 and fall 7 percent less than the 5-year average. USW believes slower export sales could be attributed to HRS FOB prices between September and December 2019 that were higher than last year at the same time.1 Between late September and late December 2018, the average nearby FOB price for HRS off the Pacific Northwest (PNW) was $259 per MT. Between late September and late December 2019, the average nearby FOB price for HRS out of the PNW was $271 per MT, 5 percent more than the same period last year. Yet year-to-date exports to the top two importers of HRS are only slightly behind last year’s pace. Exports to Japan and Korea, top 5 importers of HRS, are both ahead of last year’s pace at 514,000 MT and 362,000 MT, respectively.

1Source: USW Price Report.

Commercial Sales - U.S. Wheat Sales by Class - JAN20

Soft Red Winter (SRW)

Export sales of 2.10 MMT for SRW through Dec. 26, 2019, are 6 percent less than 2018/19. This difference relates mainly to increased SRW export prices due to a significant decline in exportable supplies. USDA predicts 2019/20 SRW ending stocks will fall to 3.02 MMT, 30 percent less than 2018/19, if realized. USDA forecasts total SRW exports will fall 22 percent year-over-year to 2.72 MMT. Year-to-date commercial sales of SRW to all destinations make up 77 percent of USDA’s total SRW export estimate. Despite lower production and higher prices, SRW sales to five of the top ten export markets are ahead of last year’s pace. Exports to Mexico, the top destination for SRW, total 641,000 MT, up 2 percent from last year. Sales to Colombia and Nigeria, both top 5 export markets for SRW, are up 38 percent and 20 percent from last year, respectively. Imports by Brazil are also running at a faster pace so far this marketing year.

White Wheat (Soft and Hard2)

USDA predicts “white wheat” exports (which includes 99.7 percent soft white) will fall 3 percent in 2019/20 to 5.20 MMT. As of Dec. 26, 2019, export sales of white wheat at 3.77 MMT are 8 percent behind last year’s pace and make up 73 percent of USDA’s final export estimate. The sales pace on the same date for four of the five top white wheat export markets is less than last year. According to industry experts, routine demand from these top markets is lagging in part because some importers believed FOB prices were too high throughout the first half of 2019/20. Some price sensitive buyers in Southeast Asia were focused on relatively low-cost Black Sea supplies. However, export sales to the Philippines, the top market for white wheat, are 9 percent ahead of last year’s pace at 1.0 MMT. USW believes routine demand from top buyers may pick up again in the second half of 2019/20 as Black Sea exportable supplies dwindle before harvest and U.S. white wheat prices grow more competitive with the shortage of Australian white classes.

2USDA sales reports combine SW and hard white (HW) export sales.

Durum

Year-to-date U.S. durum exports total 790,000 MT, which is significantly ahead of the same time last year. Despite significantly lower production, between October and November 2019 USDA increased its 2019/20 U.S. durum export forecast by 40 percent from 680,000 MT to 950,000 MT. Italy and other European Union (EU) countries are significant U.S. durum importers. Demand appears to be up in 2019/20 because EU durum production was 12 percent less than last year. As of Dec. 26, 2019, U.S. durum exports to Italy are more than double last year’s pace at 462,000 MT.

thumbnail

By USW President Vince Peterson

Recently, I have heard several of the farmers that U.S. Wheat Associates (USW) represents say they are hoping for a much better year in 2020. No wonder, given the low farmgate prices, trade uncertainty and difficult harvest conditions last year. A better year would be good for our farmers and for our overseas customers, too, who want farmers to have the incentive to continue producing a reliable supply of high-quality U.S. wheat.

From the perspective of global supply, demand and trade factors, we do see mostly positive influences hovering just out in front of us as we start the new year. After a long-term bear market that pulled Chicago wheat futures down from $9.50 in 2012 to a bottom of nearly $3.50, recent firmness in prices represents possible change and momentum on the horizon.

To highlight the primary market factors, we can start with a look at the Southern Hemisphere. Australia remains in the grips of drought that has reduced this year’s harvest outlook by 35 percent below their 10-year average. Australian wheat export prices are currently among the world’s highest at around $265 per metric ton (MT) FOB. In Argentina, the newly elected government has increased export taxes again for wheat from 7 percent to 12 percent (soybean export taxes were raised by 30 percent!). The bump in wheat export taxes raises FOB prices by more than $10 per MT, allegedly to protect domestic producer prices. That is not good for their importing customers, particularly for Brazil. However, after more than a dozen years of negotiations, Brazil on January 1 opened its 750,000 MT duty free tariff rate quota (TRQ), potentially advancing wheat import demand from outside Mercosur. When Mercosur wheat supplies have been tight, U.S. farmers have supplied an average of 80 percent of Brazil’s non-Mercosur needs.

In the Northern Hemisphere, Russian wheat export expectations have been reduced based on lower domestic supplies and prices for their standard 12.5 percent protein wheat (calculated on a dry matter basis and is most closely comparable to U.S. HRW 11 protein calculated on a 12 percent moisture basis). Russian FOB export prices are now around $219 per MT, with U.S. hard red winter (HRW) 11 percent at approximately $222 FOB from the Gulf. Long gone are the $40 to $50 per MT FOB discount spreads that have disrupted what would be normal logistical trade patterns in some recent years.

In its December “Wheat Outlook” report, USDA noted that cuts in wheat production in Argentina, Australia and Canada create potential opportunities for U.S. wheat exports in marketing year 2019/20.

In trade, despite the uncertain slog of negotiations, the United States has completed trade deals with Mexico through the finalization of the U.S.-Mexico-Canada Agreement (the new NAFTA) and through an initial bilateral agreement on agriculture with Japan. U.S. wheat export shipments to Mexico in marketing year 2019/20 already stand at 2.74 million metric tons (MMT) versus sales at the same date last year of 2.18 MMT. Together, Mexico and Japan account for more than 4.0 MMT and 25 percent of all U.S. wheat export sales to date.

Finally, trade negotiations with China, which have been perhaps the biggest weight on U.S. wheat market fundamentals and psychology, appear to be at a more hopeful position. This week, President Trump announced that the U.S. and China will sign a so-called Phase One deal on January 15. Based on information provided by the Office of the U.S. Trade Representative, China has agreed under the Phase One agreement to cancel retaliatory tariffs and import significantly more U.S. agricultural products, including wheat. Running parallel to this potential demand, China has also agreed to start filling its annual 9.6 MMT reduced tariff TRQ for imported wheat. In the five years before the start of the U.S.-China trade “war” in 2018, U.S. wheat exports to China averaged 1.5 MMT per year. That provides a logical basis for a more robust world and U.S. wheat trade with China.

Over the last five years or so, U.S. wheat producers have shouldered many challenges and continued to produce the highest quality, most wholesome milling wheat in the world, as they have done for decades. We do not yet know if these positive shifts in market and trade factors will provide the economic boost they need. But in that hope, our team at USW will be watching how they affect the markets – and how that will affect our overseas customers.

thumbnail

By Claire Hutchins, USW Market Analyst

In its December World Agricultural Supply and Demand Estimates (WASDE) report, USDA now expects world wheat production for marketing year 2019/20 to increase by 5 percent to 765 million metric tons (MMT) from last year’s 731 MMT. Lower expected production in Argentina and Australia likely encouraged USDA to also increase its forecast for U.S. wheat exports in 2019/20 by 4 percent. Already expected, record-setting total use was also raised.


USDA said increased wheat production is mainly in the Northern Hemisphere. The report noted European Union (EU) 2019/20 wheat production increased 12 percent over last year to 154 MMT, total Black Sea wheat production increased 6 percent over 2018/19 to 131 MMT, and U.S. wheat production increased 2 percent year-over-year to 52.3 MMT.

That volume more than offset lower output south of the equator where prolonged droughts continue to challenge wheat producers in Argentina and Australia. Argentinian wheat production is forecast to fall 3 percent from last year to 19.0 MMT. Australian wheat production is expected to decline by 7 percent year-over-year to 16.1 MMT, the country’s lowest wheat output since 2007/08.

USDA forecasts total U.S. wheat exports in 2019/20 will reach 26.5 MMT, up from its November estimate of 25.9 MMT and 4 percent greater than last year’s 25.5 MMT. As of November 28, according to USDA export sales data, total U.S. wheat exports of 16.5 MMT outpace last year’s sales by 9 percent. Exports to five of the top 10 markets for U.S. wheat are ahead of last year’s pace. Notably, U.S. wheat exports to Mexico are up 27 percent on the year. Hard red winter (HRW) and durum exports in 2019/20 both outpace last year’s sales.

Pacific Northwest (PNW) and Gulf hard red spring (HRS) free on board (FOB) prices have remained steady and high following a wet, difficult harvest and minimal farmer selling. Despite these higher price levels, USDA increased its HRS export estimate from 6.94 MMT in October to 7.08 MMT in December.

USDA also predicts a significant increase in total wheat consumption in 2019/20 compared to last year. Total global consumption is expected to reach a record 754 MMT, 2 percent greater than 2018/19. USDA expects the top three importers of wheat, Egypt, Indonesia and Brazil, to increase total wheat imports year-over-year. Total wheat imported by these three countries is expected to increase 4 percent over last year to 31.2 MMT.

thumbnail

By Claire Hutchins, USW Market Analyst

It is no secret U.S. hard red winter (HRW) wheat farmers have struggled through a difficult planting season. Many industry sources believe total U.S. winter wheat planted area will fall year-over-year due to depressed local prices and challenging planting conditions. In the Southern Plains, moderate to extreme drought and frigid temperatures have challenged early crop establishment. In the Northern Plains, near-record precipitation and miserably cold weather delayed planting and continue to hamper early crop development.

When U.S. Wheat Associates (USW) reached out to the industry, however, the experts expressed some familiar optimism about next year’s crop, despite challenges in the field.

Too cold, too dry. Southwest Kansas and parts of Colorado and Oklahoma are bone-dry and cold.

“Some of the crop that was planted emerged then shriveled, and some of the crop planted in dry soil is behind on emergence. At this rate we won’t have a lot of fall tillering and the winter wheat won’t be as hardy through the winter,” says Dr. Romulo Lollato, Assistant Professor of Agronomy, Wheat and Forage Extension Specialist at Kansas State University.

This could impact wheat survival and yield as temperatures begin to drop. A lower water profile in Western Kansas following this year’s corn harvest will lead to decreased winter wheat planted area, according to Lollato. However, in central Kansas, there was enough soil moisture to support the winter wheat planted around or before the optimal planting dates.

“I’d say about 30 percent of the state’s wheat is in rough shape due to extreme dryness, 10 to15 percent is in good shape and the rest could go either way,” says Lollato.

Producers in southeastern Colorado are facing the same challenge as producers in western Kansas. Planted area could decrease slightly below last year’s 2.15 million acres (0.85 million hectares) due to moderate drought and depressed commodity prices. The HRW planted area in northeastern Colorado is also expected to be slightly down compared to last year, according to Brad Erker, Executive Director of the Colorado Wheat Administrative Committee, due to prices, some movement to spring crops and pressure on acres from the wheat stem sawfly.  Most of the winter wheat in the northeastern part of the state is emerged thanks to decent soil moisture levels at planting.

It is also extremely dry and cold in the western part of Oklahoma, which hinders HRW growth and development.

“But early dryness, paired with anticipated precipitation, could actually lead to stronger root development in the long run. And long term, it could be a mild winter which would help the crop,” says Mike Schulte, Executive Director of the Oklahoma Wheat Commission.

Too Dry. Drought conditions are worsening in southwestern Kansas, southeastern Colorado and the western Oklahoma Panhandle. Central and northern Texas is drying out, too.

Too cold, too wet. In the northern half of the Great Plains, the story is just the opposite.

“We have had a lot of challenges this year—emergence is behind the 5 year average due to weather, and the wheat that is out of the ground is getting a slow start,” says Cassidy Marn, Interim Executive Vice President of the Montana Wheat and Barley Committee.

According to USDA, Montana is slightly behind last year and the 5-year average at 97% planted, but emergence is significantly more delayed. HRW is only 75% emerged in Montana compared to the 5-year average of 94%.

“There is just not much coming out of the ground,” says Marn “It should be about five inches tall and well established, but you drive around and do not see much wheat up and growing at all.”

According to Reid Christopherson, Executive Director of the South Dakota Wheat Commission, “We’ve had near record precipitation this year which prevented winter wheat planting in some areas. We expect lower winter wheat acres this year due to extreme wetness and difficult marketing conditions.”

However, Reid adds, nearly 100% of South Dakota’s wheat is emerged and about 70% of it is rated as good to excellent.

Worst Case Scenario. Mother Nature was not kind to many farmers at harvest this year. Past USW Chairman and Vida, Mont., farmer Leonard Schock shared this sad image of what heavy snow did to a mature wheat crop that had exceptional yield potential.

thumbnail

Three and a half months into marketing year 2019/20, total U.S. export sales* as of Oct. 15 of 13.8 million metric tons (MMT), 14 percent ahead of last year’s pace. Sales to four of the top 10 U.S. wheat customers are ahead of last year’s pace. Export sales to Mexico, the top U.S. customer over a five-year period, are up 50 percent year-over-year at 2.09 MMT. Sales to Nigeria total 936,000 metric tons (MT), up sharply from the 569,000 MT sold this time last year. All U.S. wheat classes except hard red spring (HRS) and white wheat are ahead of last year’s pace. USDA projects 2019/20 U.S. wheat exports will rise to 25.9 MMT. If realized, this would be 1 percent higher than 2018/19.

HRW. USDA reported hard red winter (HRW) year-to-date exports at 5.13 MMT, 52 percent ahead of the 2018/19 HRW sales pace on the same date. Mexico is currently the number one HRW purchaser and HRW sales to Mexico are 54 percent ahead of last year’s pace. As of Oct. 10, HRW sales to Mexico totaled 1.27 MMT. Sales to Nigeria are more than double last year’s pace at 567,000 MT. Japanese HRW purchases total 488,000 MT, up 7 percent from 2018/19.

SRW. 2019/20 soft red winter (SRW) sales are up 14 percent year-over-year at 1.72 MMT. Sales to 4 out of 5 of the top buyers of U.S. SRW are ahead of last year’s pace. Year-to-date, Mexico has purchased 550,000 MT, 15 percent more than last year. Nigerian SRW purchases total 142,000 MT, 50 percent ahead of last year’s pace. Sales to other Latin American countries, including Trinidad and Tobago and Panama are also ahead of 2018/19 exports.

HRS sales of 3.77 MMT are only 1 percent behind the last year’s pace. As of Oct. 10, buyers in Taiwan purchased 353,000 MT, up 5 percent from 2018/19. Taiwan is the third-largest buyer of HRS. Sales to South Korea, the fourth-largest buyer of HRS, are up 10 percent from last year at 294,000 MT. Year-to-date sales to Southeast Asian countries, including the Philippines, Bangladesh, Thailand and Malaysia, are behind last year’s pace. This time last year, there were no HRS sales to China. So far in 2019/20, the U.S. has sold 63,000 MT of HRS to China.

White. As of Oct. 11, exports of all white wheat (including soft white and hard white) are down 14 percent year-over-year at 2.62 MMT. Sales to 4 out of the top 5 customers of U.S. white wheat are down from last year. Sales to the Philippines, the largest customer of soft white (SW) wheat, are down 6 percent from 2018/19 at 660,000 MT.  SW food aid donations to Yemen are up 79 percent from this time last year at 231,000 MT. Minimal access to the Chinese market is also impacting SW sales. In 2017/18, China had purchased 271,000 MT of SW by this date.

It should be noted that the white sales to Nigeria of 123,000 MT are hard white (HW). USDA does not differentiate between the 2 classes on the Export Sales Report. HW sales to Nigeria in 2019/20 are 9 percent ahead of last year’s pace.

Durum. Year-to-date durum exports total 497,000 MT, up 59 percent from the same time last year. To date, the European Union (EU), Algeria and Nigeria are the top durum buyers. Year-to-date sales to the EU total 269,000 MT (9.88 million bushels), more than double last year’s pace. Italy is the top durum buyer in the EU. U.S. durum sales to Italy are up 165 percent from last year at 248,000 MT. Increased sales to the EU more than offset decreased sales to Algeria and Nigeria. Algerian durum sales are down 30 percent from last year at 45,000 MT and Nigerian durum sales are down 58 percent from 2018/19 at 28,000 MT. There is also a significant portion of these 2019/20 durum sales currently designated as “sales to unknown destinations.”

*U.S. Wheat Associates (USW) publishes a new Commercial Sales report every Thursday documenting wheat export sales-to-date by country and class for the current marketing year compared to the previous marketing year on the same date. The report also includes a 10-year commercial sales history by class and country. Data is sourced from the USDA Foreign Agricultural Service Weekly Export Sales Report.