thumbnail

Given the strong surge in U.S. wheat futures prices over the past several weeks, U.S. Wheat Associates (USW) wants to share more information about the market factors behind the rise.

Some of the bullish factors do not appear to be short-lived. Driving the recent highs was remarkably higher Chinese demand for U.S. soybeans, corn and wheat; increased investments by managed money in U.S. agricultural commodities exchanges; news that the Russian government increased its wheat export tax; and continued dryness in the High and Southern Plains.

U.S. wheat futures prices for nearby delivery

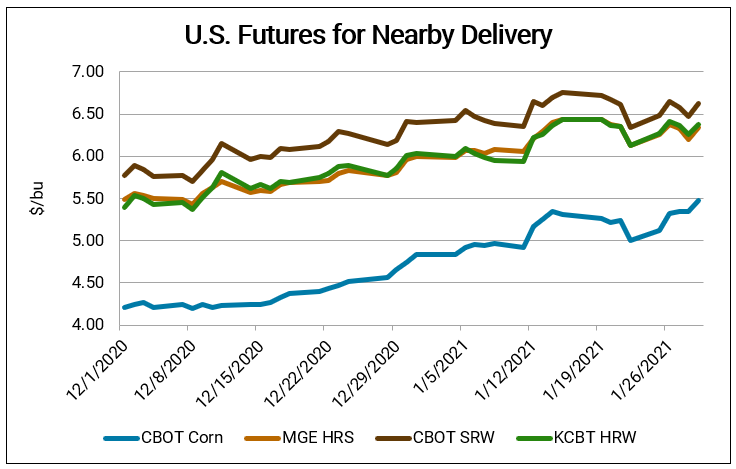
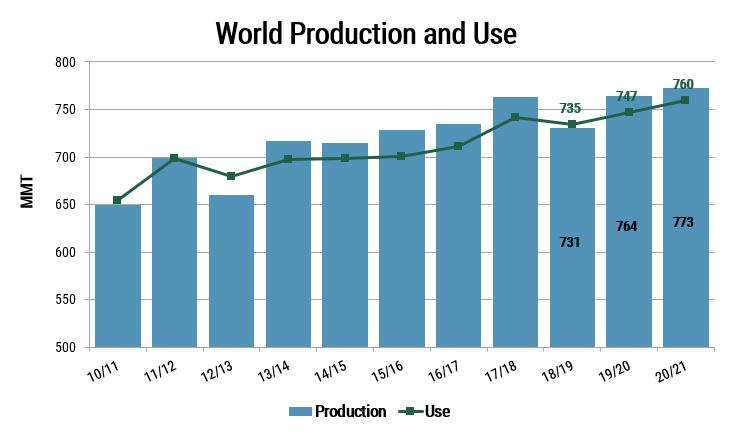
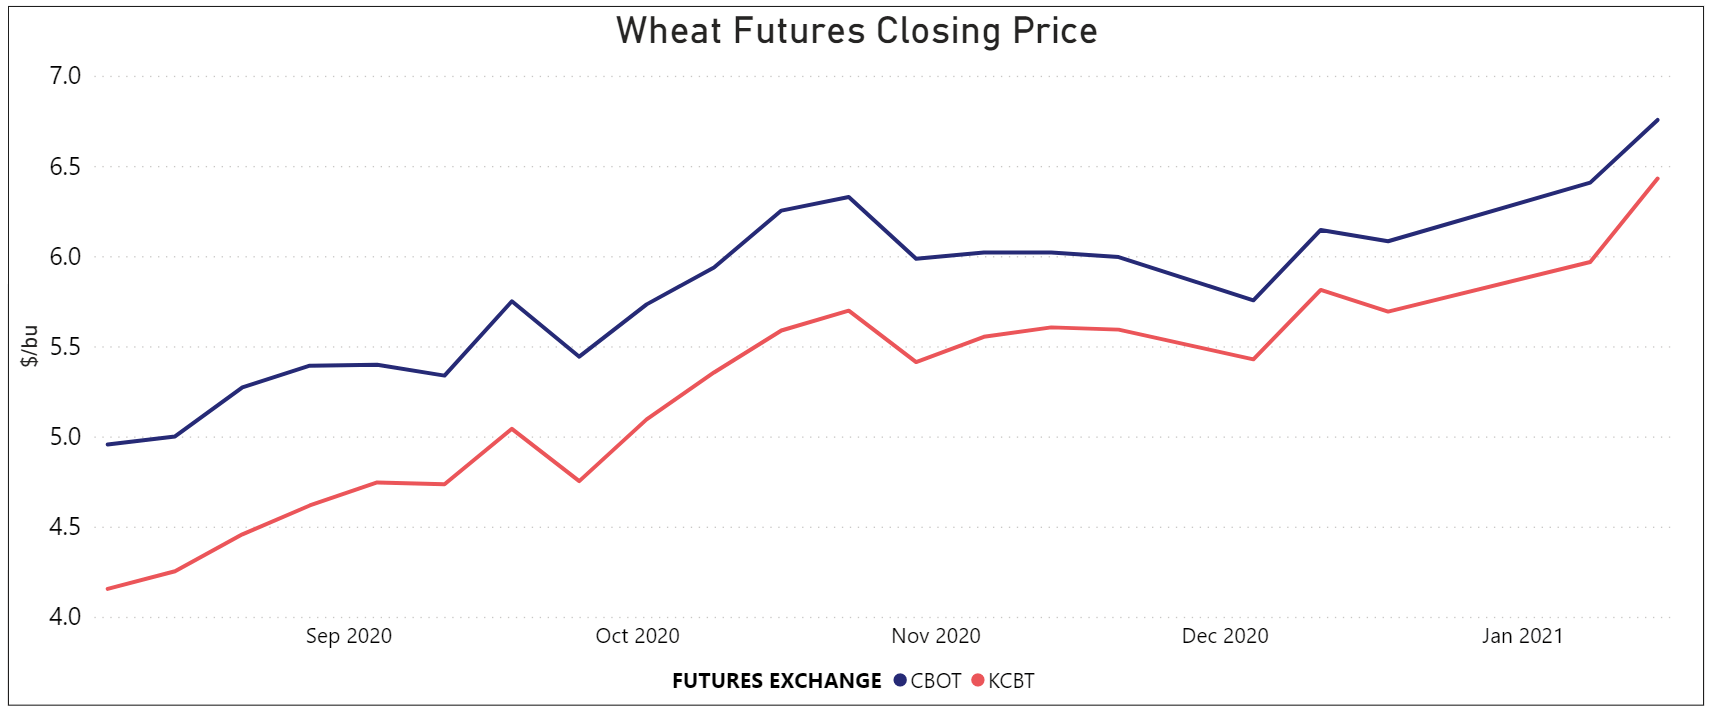
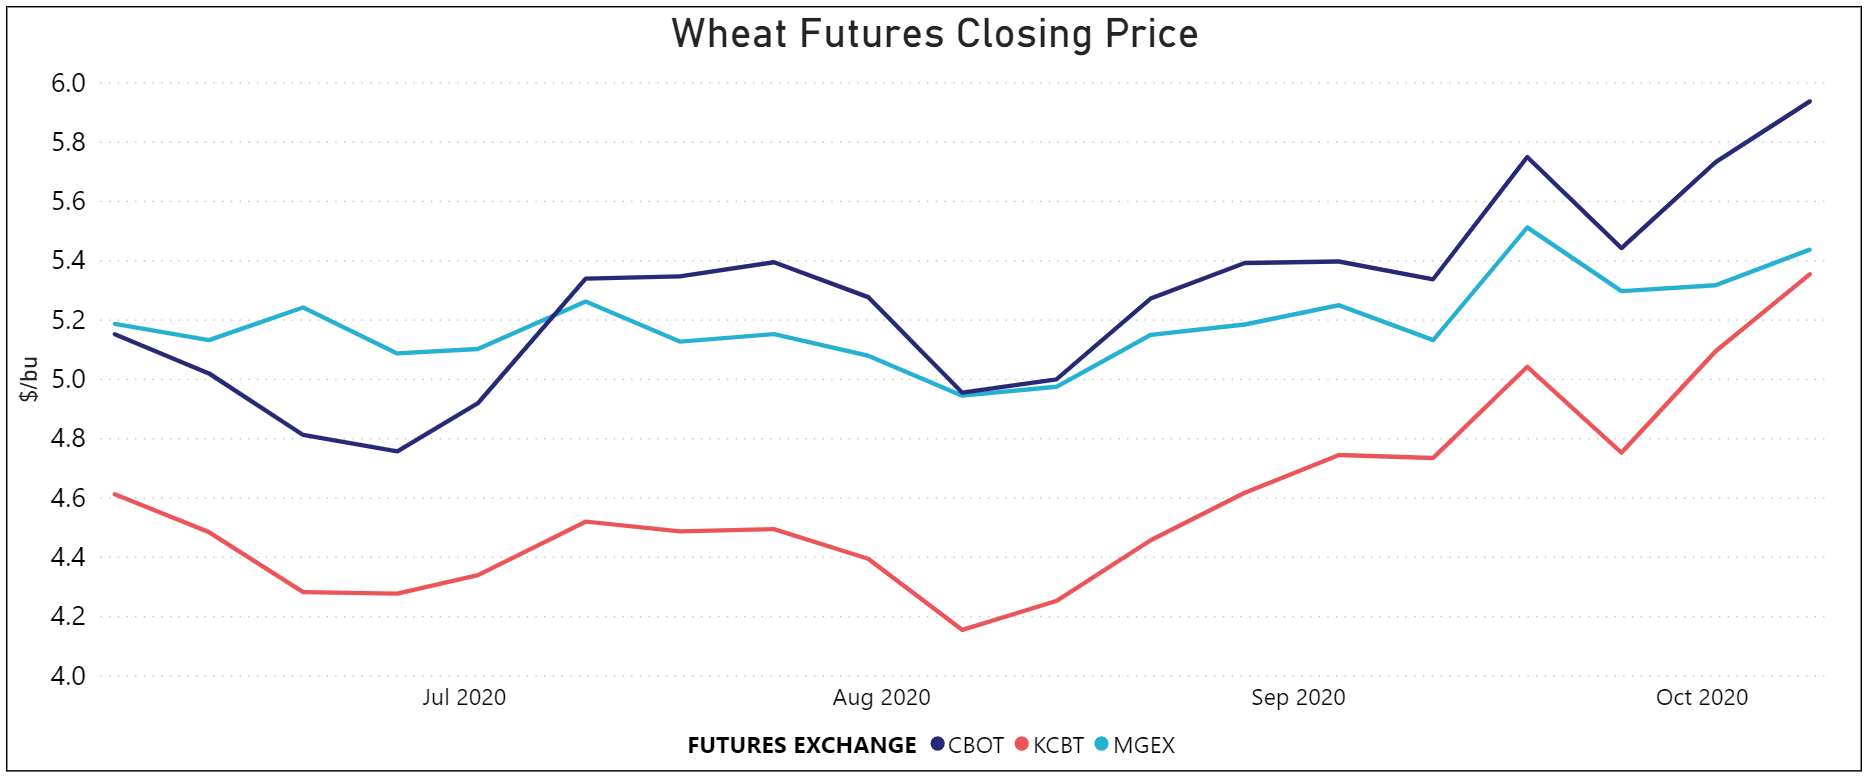
By late January 2021, CBOT soft red winter (SRW) and KCBT hard red winter (HRW) futures prices reached their highest level in more than six years and MGE hard red spring (HRS) futures prices reached their highest level since late 2017. Source: DTN

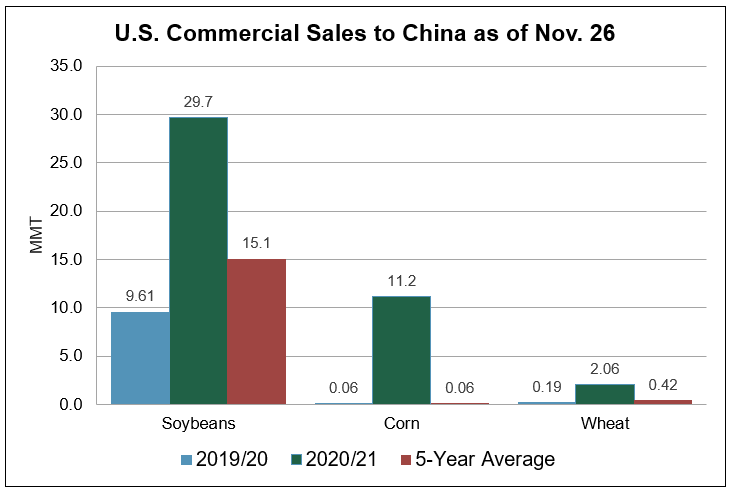
U.S. Corn, Soybean and Wheat Exports to China

Historic U.S. commodity sales to China are supporting high wheat futures prices. To date, the United States has sold 11.8 million metric tons (MMT) of corn to China, completely eclipsing the last record of 4.90 MMT shipped to China in 2013. According to Reuters, China is on track to be the largest importer of U.S. corn for the first time in history. And sales aren’t slowing down: on Jan. 29, USDA reported a flash sale of 2.10 MMT of corn to China, the largest sale of U.S. corn to an overseas customer in a single day since 1991.

U.S. soybean sales to China have also set records. To date, the U.S. has sold 34.7 MMT of soybeans to China, 190% more than this time last year and 74% more than the 5-year average.

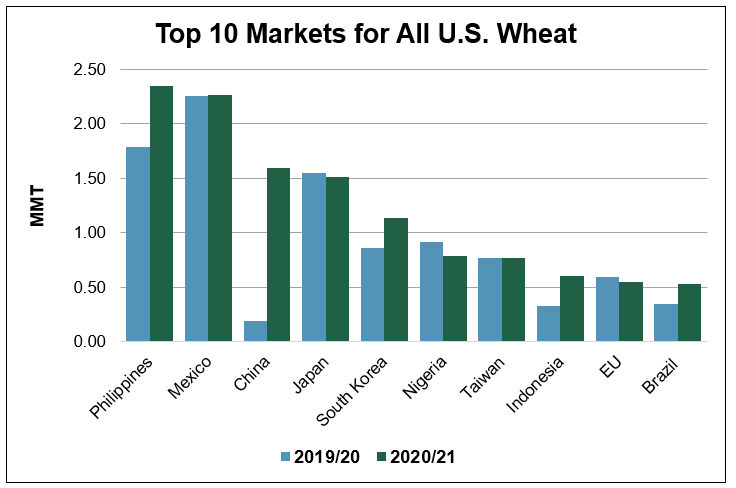
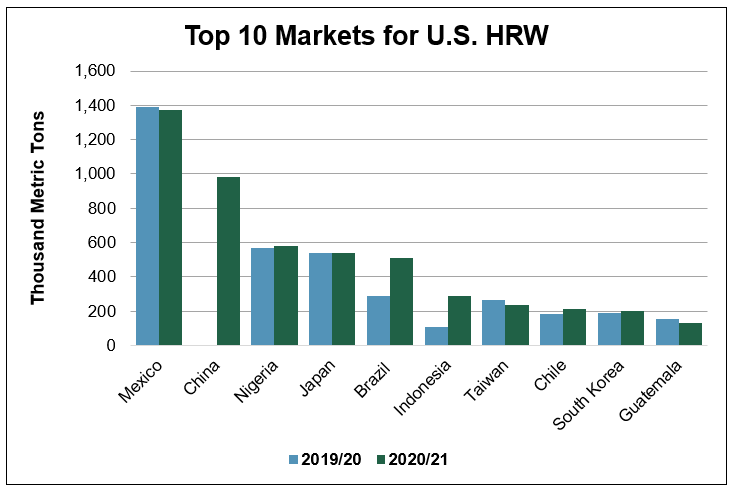
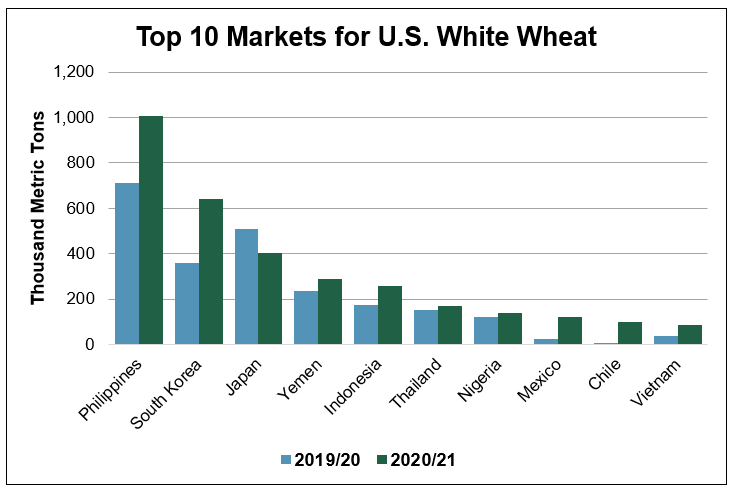
China’s demand for U.S. wheat has also been strong. Total sales to China, now the third-largest market for U.S. wheat, are substantially higher than this time last year at 2.58 MMT, more than 5 times greater than the 5-year average. HRW sales to China now total 1.13 MMT, the first major Chinese HRW purchase in many years. HRS sales to China of 566,000 metric tons (MT) are nearly nine times greater than the same period in 2020 and white wheat (soft and hard) sales are up more than 400% at 714,000 MT.

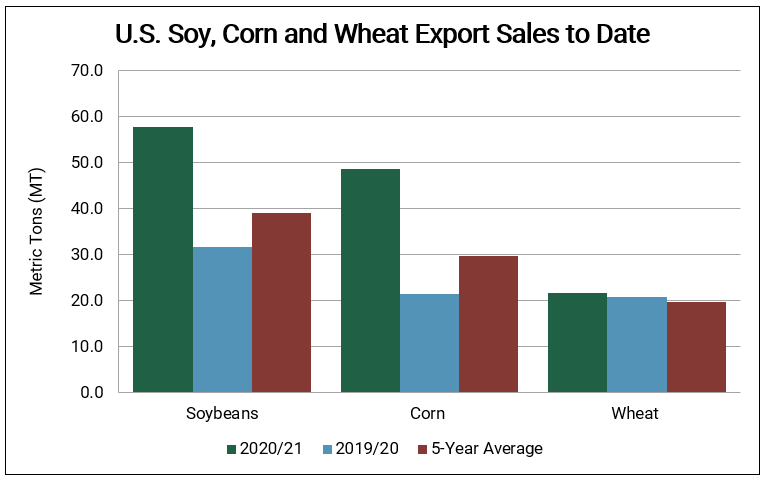
Source: USDA FAS export sales data as of Jan. 21, 2021

Technical Strength

Joining the trade excitement are managed futures funds, an investment where professionals actively manage a futures contract portfolio. These speculative commodity funds are buying significant amounts of U.S. corn, soybean and wheat futures contracts. They are “long” in the markets with the expectation that the contracts will gain value over time.

“Simply put: China is driving the boat,” said one U.S.-based trader. “Funds are pouring money into Chicago and other exchanges because of our massive balance sheet of sales to China.”

“If corn jumps 19 cents per bushel in one day, wheat is going to follow in a big way,” said another trader.

Managed fund participants serve an important role in futures markets, giving buyers and users of a commodity like wheat the opportunity to hedge their price risk through speculators that accept the risk of price movements.

Russian Wheat Export Tax

What happens in a leading wheat exporting nation can move the market. On Jan. 26, the Russian government announced it would increase the country’s wheat export tax from €25 per MT to €50 per MT for March 1 to June 30 deliveries in an attempt to secure domestic food supplies and stabilize domestic prices. After Russia’s government approved the tax increase, Minister of Economic Development Maxim Reshetnikov said: “We hope in the near future the price situation will stabilize and we will be able to switch to a permanent mechanism of export duties.” Even so, USDA expects total Russian wheat exports in 2020/21 will reach 39.0 MMT, up 13% from last year and 18% more than the 5-year average, if realized.

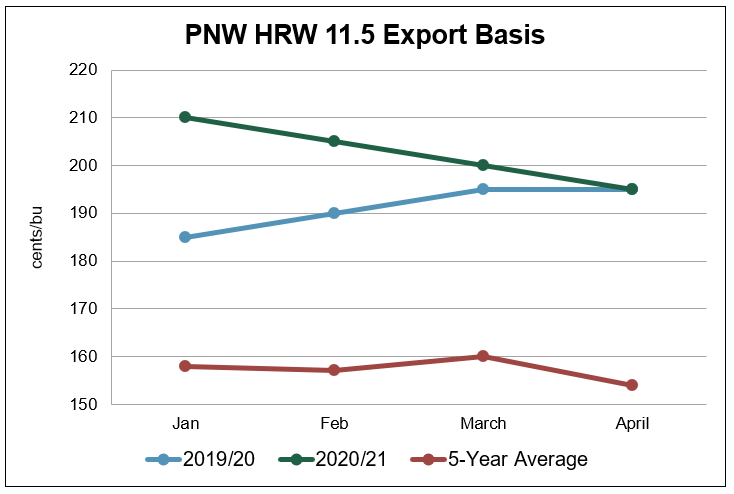
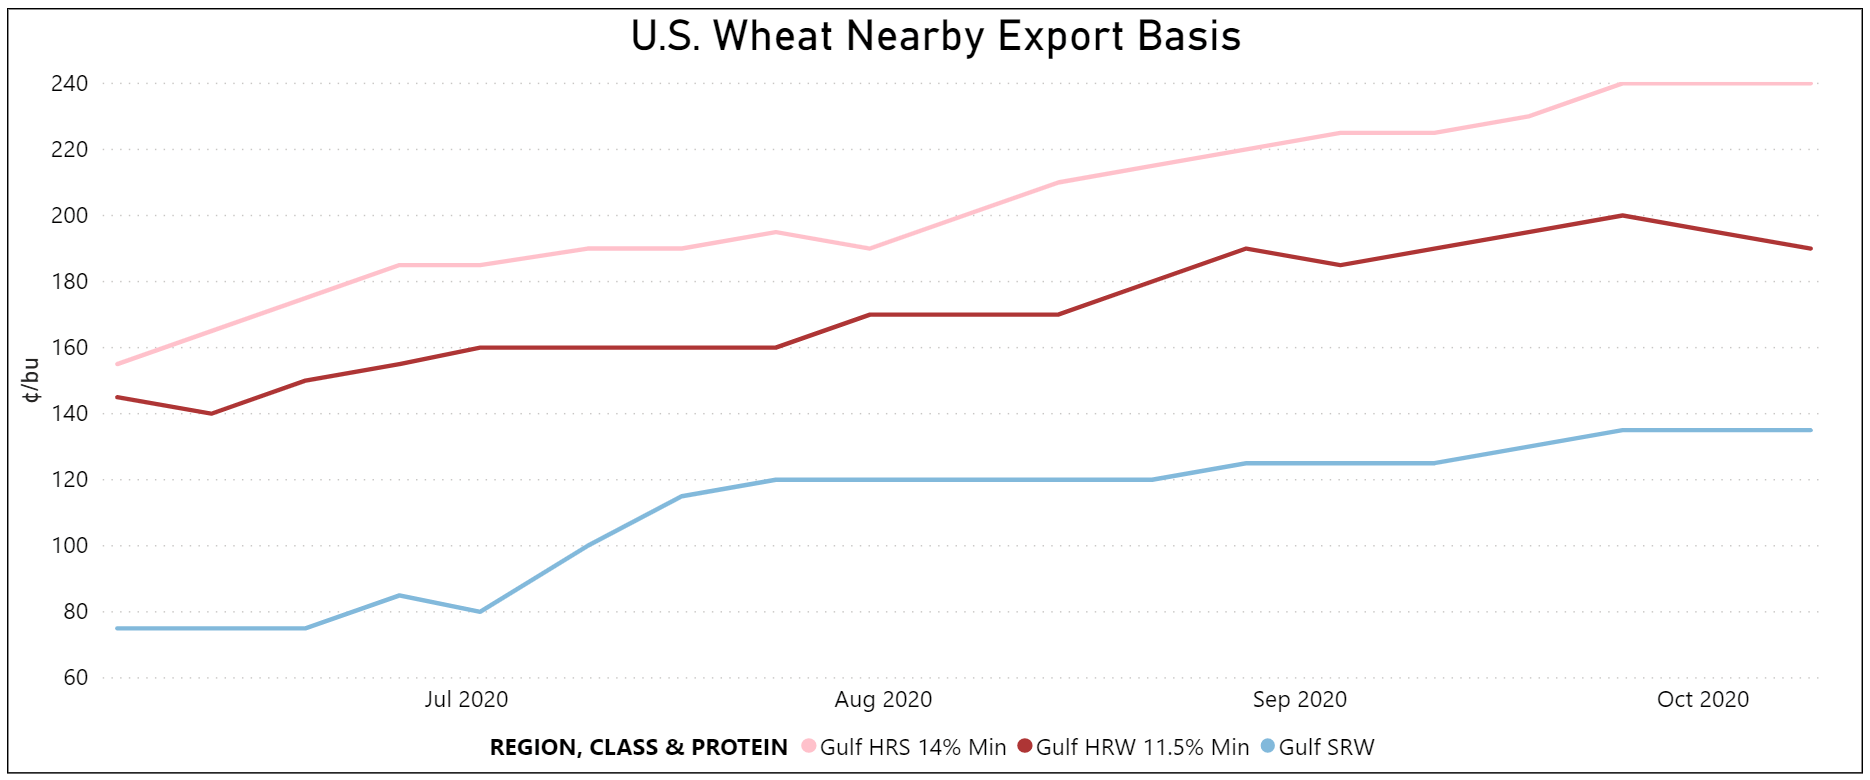
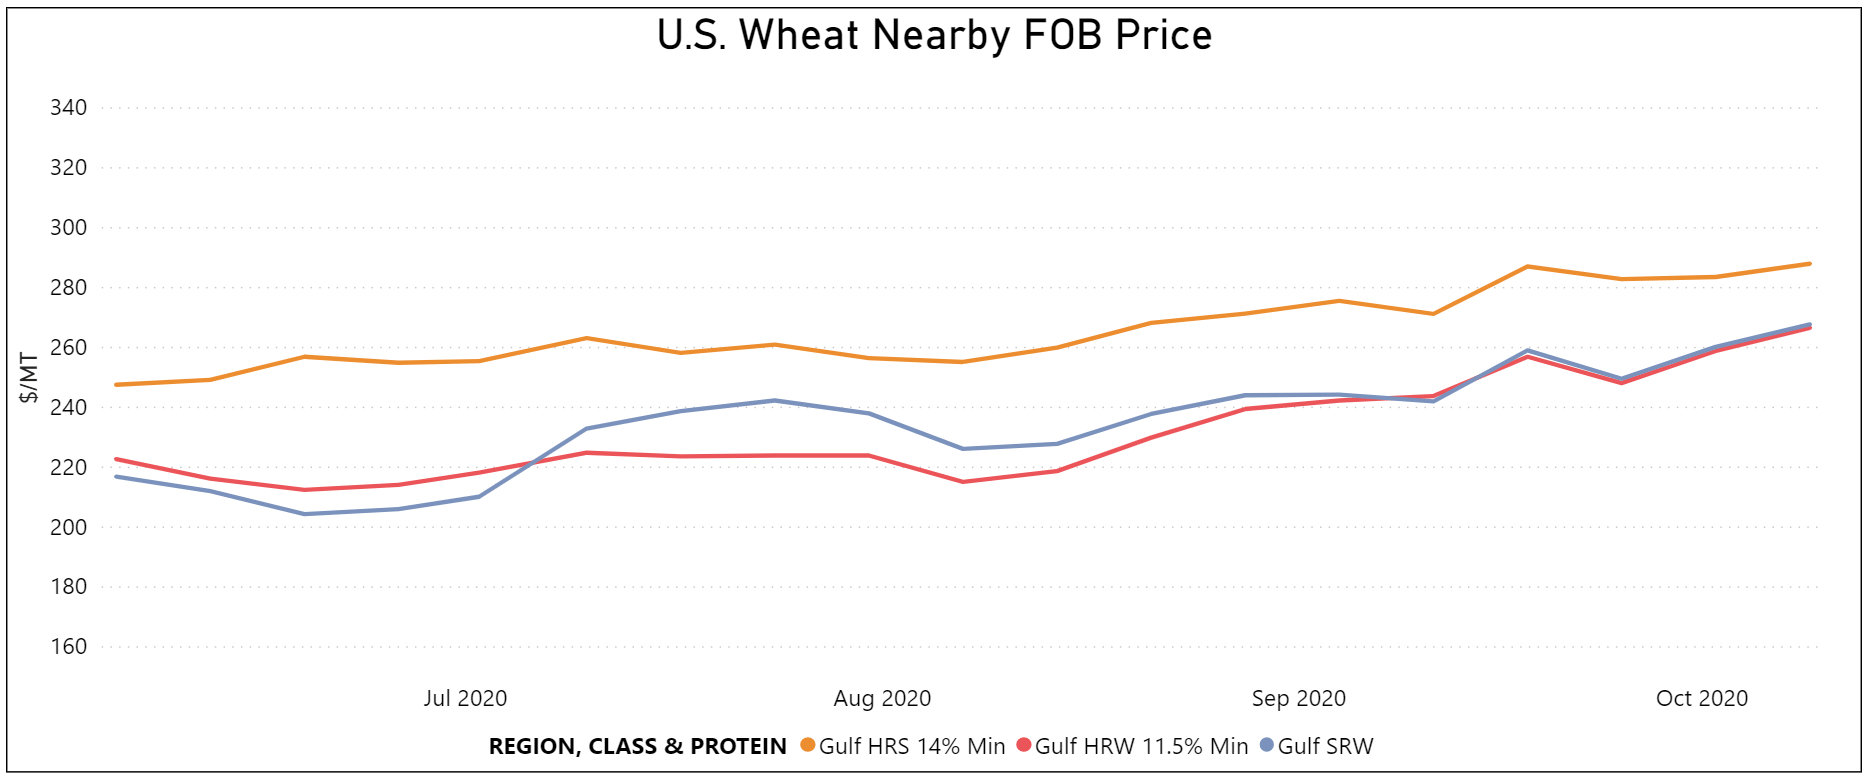
The increased wheat export tax and minimal domestic selling by Russian farmers have also supported global wheat export prices. According to AgriCensus, between early December 2020, before the initial €25 per MT tariff was announced, and early February 2021, Russian 11.5% protein wheat (dry matter basis) free on board (FOB) prices increased 15% to $292 per MT. By comparison, Texas Gulf 11% HRW (12% moisture basis) FOB traded at $280 per MT at the beginning of February.
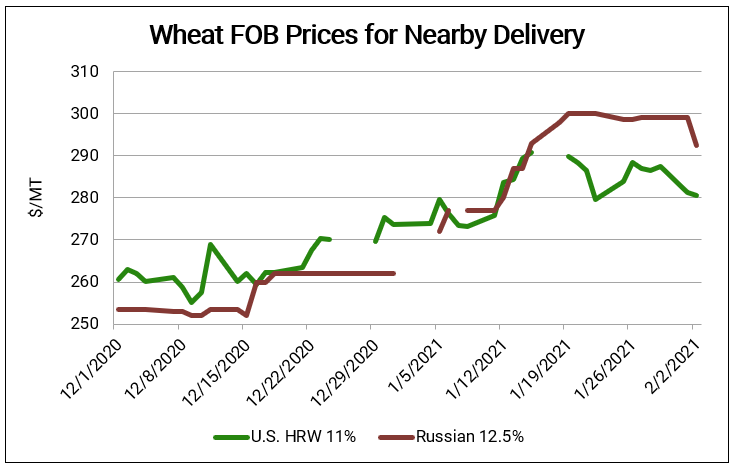
Source: AgriCensus

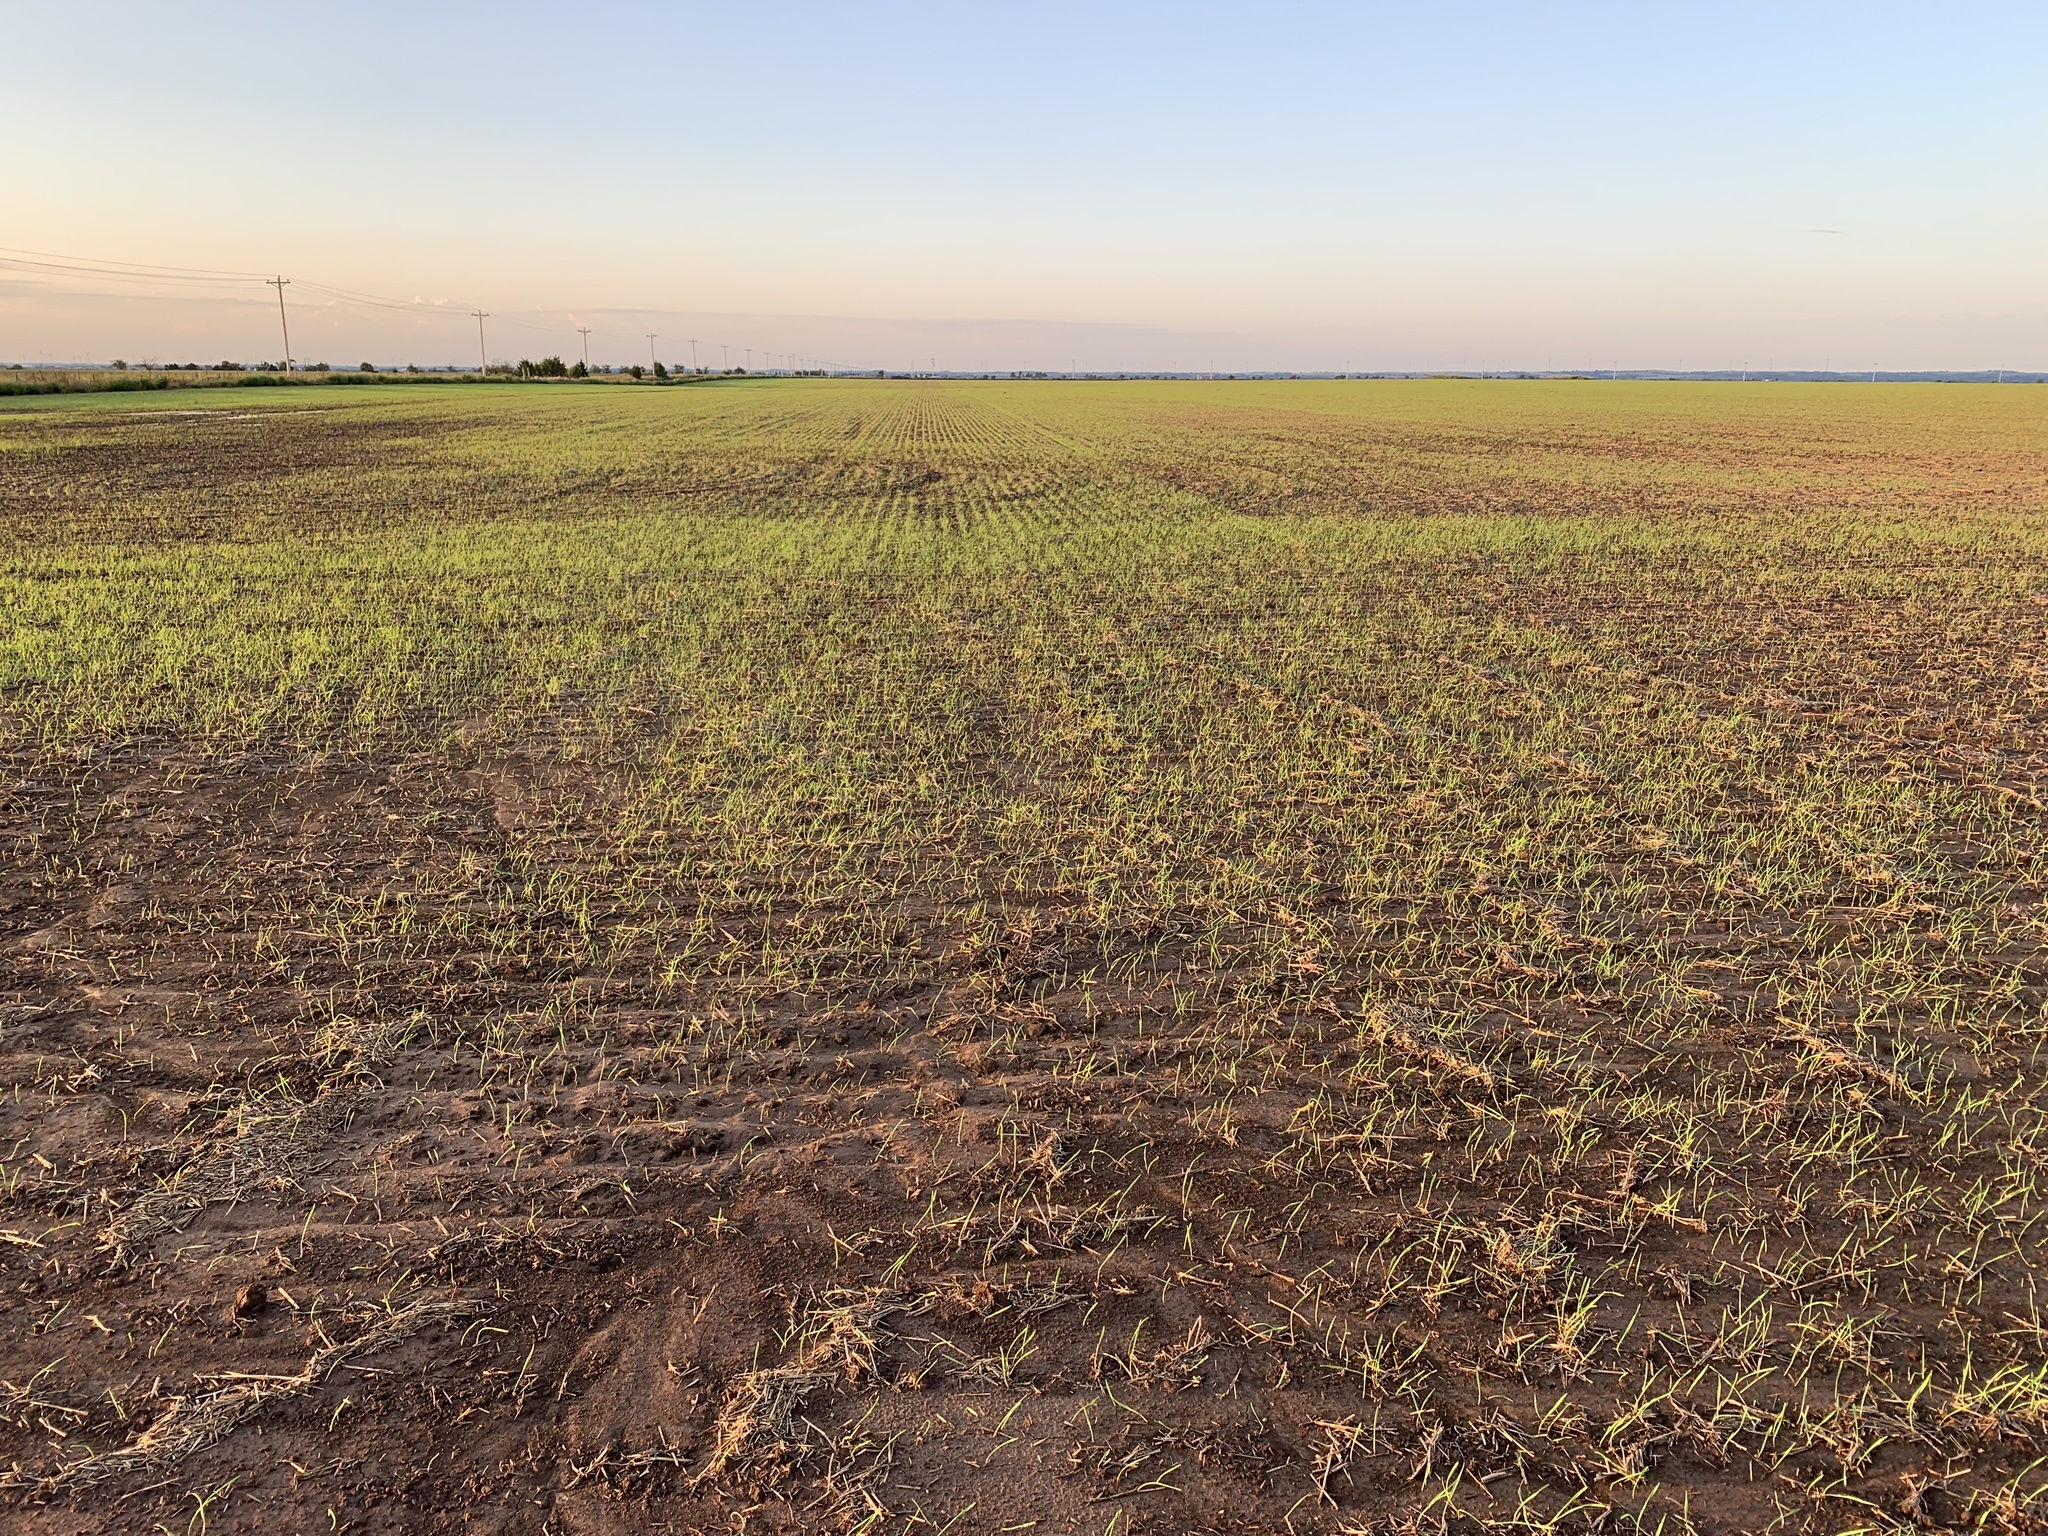
Drought Stress Across the Great Plains

Despite recent precipitation in some areas, extreme dryness continues to plague U.S. winter wheat producers, an all too familiar situation for wheat farmers in eastern Colorado, western Kansas, western Nebraska and eastern Wyoming.

“Dryness in the Plains adds underlying support to wheat futures prices,” said a grain trade representative.

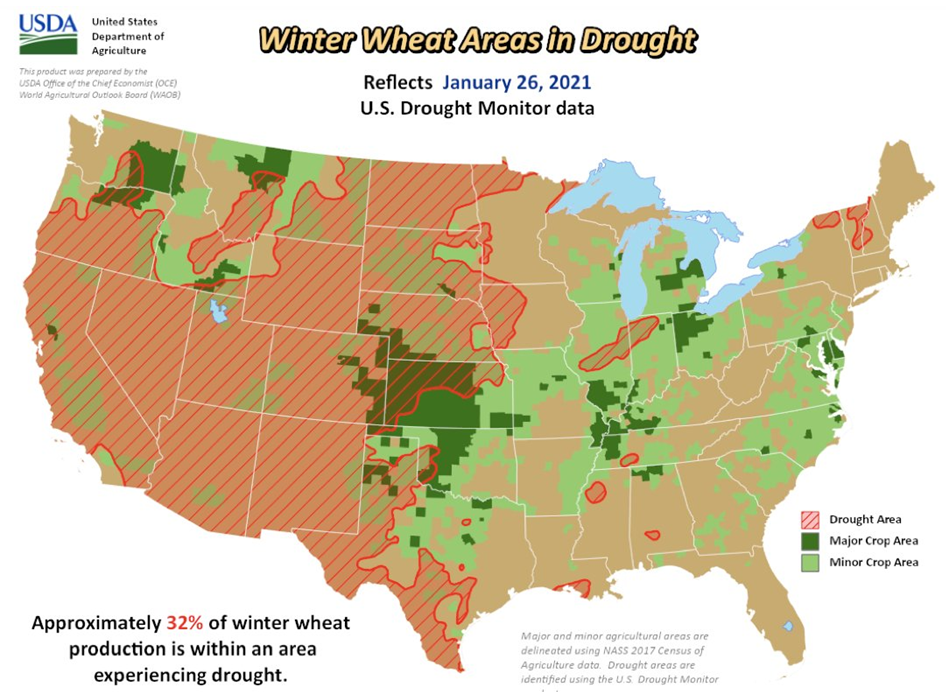
As of Jan. 28, according to USDA, Colorado winter wheat ratings slipped from 19% good to excellent in early January to 17% by late January and 43% of Kansas winter wheat was rated good to excellent, down from 46% in late December 2020. USDA also reported that as of Jan. 26, 2021, “an estimated 32% of U.S. winter wheat production is within an area experiencing drought,” including major sections of U.S. hard red spring and northern durum production regions.

Every Friday, USW compiles information from market sources, including U.S. wheat exporters of all classes from various U.S. ports.

By Claire Hutchins, USW Market Analyst

thumbnail

The U.S. Wheat Associates (USW) Board of Directors includes wheat farmer leaders appointed to represent each of the 17 state wheat commissions that are members of USW and meets three times during each marketing year (June to May). For each of the meetings, the USW Market Analyst prepares a “Wheat Supply and Demand Outlook” report based on USDA market data to provide an update on the global and U.S. wheat market. The full Winter 2021 report is posted at https://bit.ly/MarketSummary012721.

The report includes sections on world wheat supply and demand, wheat production in the major wheat exporting countries and regions, including U.S. wheat production by class, timely reports such as U.S. wheat seeded area, and U.S. commercial wheat sales.

World Production and Use data from the Winter 2021 Wheat Supply and Demand Outlook

The latest report, prepared Jan. 27, 2021, indicates marketing year 2020/21 is a significant one, with several records set. For example, USDA expects global wheat production to reach 773 million metric tons (MMT) following increased annual production in Australia, Russia and Canada among exporting countries. World wheat trade is expected to increase 1% to a record 194 MMT, which would be 7% more than the 5-year average. With strong carryover from 2019/20 and increased production, global wheat ending stocks are projected at 313 MMT, with China expected to hold 159 MMT and India 31.3 MMT of that total at the end of 2020/21. U.S wheat ending stocks, however, are expected to be the lowest since 2014/15.

USDA has also reported that U.S. winter wheat seeded area (including hard red winter, soft red winter, fall seeded soft white, hard white and Desert Durum®) increased for the first time since 2013/14. Hutchins notes in the report that beneficial field conditions and strong farmgate price potential at planting time motivated hard red winter and soft red winter wheat producers to increase planted area from last year.

U.S. Winter wheat planted area data from the Winter 2021 Wheat Supply and Demand Outlook

View the full Winter 2021 Wheat Supply and Demand Outlook at https://bit.ly/MarketSummary012721.

thumbnail

For the first time since 2013/14, total U.S. winter wheat planted area increased on the year as producers took advantage of dry seeding conditions and strong prices through fall 2020. USDA’s 2021/22 Winter Wheat Seeding report, released Jan. 12, reported U.S. farmers planted 32.0 million acres (12.9 million hectares) of winter wheat for harvest in 2021, up 5% from marketing year 2020/21. Increases for hard red winter (HRW) and soft red winter (SRW) more than offset a slight decrease in white winter wheat planted area.

Hard Red Winter

USDA assessed HRW planted area at 22.3 million acres (9.02 million hectares), up 4% on the year. Planted acreage is up year-over-year in several major HRW-producing states with the largest increases reported in Montana, South Dakota and Kansas. Montana planted area increased 10% on the year to 1.70 million acres (688,000 hectares) and South Dakota planted area jumped 13% from last year to 710,000 acres (287,000 hectares). In both states, dry planting conditions from September to October were a welcome change compared to sodden, impassable fields in fall 2019.

“To look at this year, we have to first go back to fall 2019 planting when fields were extremely wet and producers left many acres to prevent plant,” said Reid Christopherson, executive director, South Dakota Wheat Commission. “Finally, in fall 2020 there was optimism around wheat. Conditions for seeding were good and prices were giving us encouragement, which boosted HRW planted area.”

In Kansas, HRW planted area for harvest in 2021 is up 10% from last year at 7.30 million acres (2.95 million hectares) as extreme dryness deterred producers from planning to plant corn, which is more water intensive than wheat.

Strong markets also incentivized the expansion of U.S. winter wheat acres. According to Justin Gilpin, CEO, Kansas Wheat Commission, many fallow acres in western Kansas went back into winter wheat last fall as producers reacted to a spike in futures prices. Between late August and mid-October, Kansas City Board of Trade (KCBT) HRW futures prices for nearby delivery jumped 18% to $5.59/bu, the highest since August 2018, as “managed money” or commodity funds bought significant amounts of U.S. wheat futures contracts with the expectation that the contracts would gain value over time.

HRW planted area in Colorado and Oklahoma, two other major winter wheat producing states, also increased several percentage points on the year as producers jumped on higher HRW prices.

Soft Red Winter

Total SRW planted area of 6.23 million acres (2.52 million hectares) is up 12% from 2019 and 8% from the 5-year average as producers took advantage of pristine planting conditions and strong Chicago Board of Trade (CBOT) futures prices. Increases in major SRW-producing states more than offset decreases in Ohio and Maryland.

Planted area is up significantly in states tributary to the Gulf of Mexico, namely Wisconsin, Illinois, Missouri and Tennessee. Wisconsin planted area is up 72% from last year, Missouri planted area is up 38%, Illinois planted area is up 11% and Tennessee planted area is up 33%.

“Strong futures prices, strong farm gate prices and a quick soybean harvest in many Midwestern states incentivized SRW producers to plant more wheat acres this year, specifically in Wisconsin and Missouri,” said a grain trade manager.

Like with HRW futures prices, SRW futures prices also saw a significant jump during the fall planting season as commodity funds poured money into the Chicago futures exchange.

Every Friday, U.S. Wheat Associates (USW) publishes its Price Report, compiling information from market sources, including U.S. wheat exporters of all classes from various U.S. ports. Subscribe here to receive the weekly report.

By Claire Hutchins, USW Market Analyst


thumbnail

By Claire Hutchins, USW Market Analyst  

Seven months into marketing year 2020/21, USDA currently forecasts total U.S. wheat export sales will reach 26.8 million metric tons (MMT), which, if realized, would be 2% more than 2019/20 and 7% more than the 5-year average. As of Dec. 24, U.S. wheat commercial sales are 9% ahead of last year’s pace at 20.6 MMT, led by hard red winter (HRW), hard red spring (HRS) and white wheat (soft and hard).

U.S. hard red winter wheatHard Red Winter

Total HRW sales of 7.10 MMT are 3% ahead of last year and are 7% ahead of the 5-year average as significantly increased exports to Nigeria and China more than offset reduced sales to Mexico, the largest market for HRW.

Current sales to Nigeria of 758,000 metric tons (MT) are up 30% on the year due to greater export elevation capacity out of the Texas Gulf compared to other U.S. export terminals. While exporters in the Center Gulf and Pacific Northwest (PNW) have to balance massive commodity export programs, which makes it comparatively more expensive to elevate wheat, exporters in the Texas Gulf have fewer commodities and lower volumes to balance, making it easier and less expensive to elevate and ship HRW.

As of Dec. 24, China has purchased 1.12 MMT of HRW after no purchases in 2019/20. Strong HRW export sales so far in 2020/21 can be attributed to the Phase One agreement between the United States and China. So far in MY 2020/21, China is the second-largest market for HRW behind Mexico.

Export sales to Mexico are down 8% on the year at 1.65 MMT due to volatility in the value of the peso and significantly reduced restaurant demand following the COVID-19 outbreak.

U.S. hard red spring wheatHard Red Spring

Total HRS export sales of 5.78 MMT are 9% ahead of this time last year and are 4% ahead of the 5-year average. Sales to the Philippines and Japan, the top two markets for HRS, are up 5% and 6% respectively on competitive prices and increased focus on food stability following the COVID-19 outbreak, says the trade.

Export sales to China, now the third largest market for HRS, are up more than 700% on the year at 518,000 MT following the Phase One trade agreement.

U.S. soft white wheatWhite Wheat

Total U.S. white wheat sales, represented mainly by soft white (SW) wheat, are 47% ahead of this time in 2019/20 at 5.52 MMT and are 49% ahead of the 5-year average. In the Philippines, the largest market for U.S. SW, export sales are up 5% from this time last year and 29% from the 5-year average on competitive SW prices compared to other classes of U.S. wheat. The increased demand by Philippine millers is also partially due to early customer buying in response to tight export elevation capacity in the PNW. Strong U.S. Wheat Associates (USW) educational programs in the Philippines helped customers stay informed and make timely buying decisions in the first half of MY 2020/21.

SW sales to key Southeast Asian markets like Vietnam, Thailand, Malaysia and Indonesia are more than 20% ahead of last year’s pace as customers work to secure inexpensive, high quality supplies for 2020/21 delivery before the large Australian harvest comes to market.

U.S. soft red winter wheatSoft Red Winter

SRW export sales remain sluggish. Total SRW export sales are down 25% on the year at 1.57 MMT, down 28% from the 5-year average. SRW export sales to 7 of the country’s top 10 overseas markets are behind last year’s pace.

“SRW prices are just too high right now,” said one grain trader, “the United States is priced out of the world market, especially to our buyers in Latin America and Nigeria.” Limited exportable supplies of SRW along the Mississippi River due to lower planted area in key states and extremely tight export elevation capacity in the Center Gulf due to increased export demand for soybeans and corn supported SRW export prices in the first half of MY 2020/21.

Between early June and late December 2020, the average SRW free on board (FOB) price was $247/MT, 12% higher than the same period last year. According to AgriCensus, over that period, the average SRW FOB price was 11% higher than Russian 11.5% protein wheat (on a dry matter basis), a key competitor into Latin America and Nigeria.

To date, sales to Mexico and Colombia, the two largest markets for SRW, are down 10% and 26% from this time last year, respectively. Though SRW sales to Mexico are down on the year, sales of SW to Mexico are up 289% from last year at 92,000 MT as customers take advantage of the significant price difference between the two classes.

As of Dec. 24, there are no SRW export sales to Nigeria compared to last year’s volume of 171,000 MT.

U.S. durum wheatDurum

Year-to-date durum sales in 2020/21 are 25% behind last year’s pace at 590,000 MT but are 20% ahead of the 5-year average. Total sales to Italy, the largest market for U.S. durum, are only 6% behind last year’s pace at 433,000 MT, which is 63% more than the 5-year average.


U.S. Wheat Associates (USW) publishes a commercial sales report every week on Thursdays on it’s website.

thumbnail

By Claire Hutchins, USW Market Analyst

Since June, U.S. Wheat Associates (USW) has carefully tracked the relationship between limited export elevation capacity and high U.S. wheat export basis values. Significantly greater Chinese demand for U.S. agricultural products has limited export elevation availability, causing an increase in wheat export basis values for October 2020 through February 2021 deliveries. However, the anticipation of seasonally reduced Chinese demand for U.S. agricultural goods could pressure U.S. wheat export basis levels for March 2021 and forward delivery periods.

The United States has sold historic levels of soybeans, corn and wheat to China for delivery in 2020/21 following the Phase 1 Trade agreement between both countries. As of Nov. 26, soybean sales to China at 29.7 million metric tons (MMT) are more than three times greater than this time last year and are nearly double the 5-year average. Corn sales to China at 11.2 MMT are magnitudes greater than late November last year and the 5-year average. Total wheat sales to China at 2.06 MMT are more than ten times greater than this time last year and are nearly five times greater than the 5-year average.

Source: USDA FAS Commercial Sales data


“January, February and the beginning of March are at capacity; we can’t add a lot more business for those months,” said one industry contact. “If anyone were to sell anything for those delivery periods, it would raise elevation costs substantially more.”

Though wheat export basis levels are projected to remain high through early March 2021 as traders work to execute the large volume of existing commodity sales, industry contacts currently predict a sizeable decrease in U.S. wheat forward export basis values if China’s demand for U.S. corn subsides and if Chinese buyers shift to importing Brazilian soybeans.

According to Trade Data Monitor (TDM), most Chinese soybean imports usually come from the United States between October and February and from Brazil between March and September. On average, soybeans from Brazil jump from 46 to 83 percent of China’s total imports between February and March. Traders anticipate this seasonal trend will continue in 2021, which could increase U.S. wheat export elevation availability in the Pacific Northwest (PNW) and Gulf and could decrease wheat export basis levels from those regions.

Source: Trade Data Monitor, Chinese soybean import data from 2015 to 2019


The latest USW Price Report indicates the trade has assumed Chinese demand will slow in the first three months of 2021. The current export basis delivery values for PNW hard red winter (HRW) 11.5 protein show a 5 percent inverse between February and April deliveries.

Source: USW Price Report data as of Dec. 4


The report also shows a 10 percent inverse between February and April export basis levels for PNW hard red spring (HRS) 14.0 percent protein.


“April forward is when export basis really lightens up and we become more competitive,” said one trader, “there’s strong interest in U.S. spring wheat for that period.”

Source: USW Price Report data as of Dec. 4


While Gulf HRW and soft red winter (SRW) export basis values are forecast to remain relatively stable over the first few months of 2021, the Gulf HRS 14.0 percent protein export basis forecast currently shows a 16 percent inverse between February and April deliveries.

Source: USW Price Report data as of Dec. 4

USW does not have a crystal ball, but we do expect downward pressure on most U.S. wheat export basis values between February and April 2021, as long as China’s import demand for U.S. corn and soybeans slows down and inland logistics continue operating smoothly. USW will continue to monitor trade and logistical developments in the coming months and will communicate anticipated basis changes to our customers.

thumbnail

By Claire Hutchins, USW Market Analyst

U.S. hard red spring (HRS) wheat exports are caught in the crosshairs of an ongoing trade dispute between the United States and the European Union (EU), to the detriment of U.S. farmers and EU customers alike.

Effective Nov. 10, the European Commission (EC) announced a 25 percent import duty on hundreds of U.S. goods, including bulk agricultural commodities like non-durum wheat. The tariffs, punitive in nature, are the latest in a long-running disagreement between the United States and the EU over state subsidies to airline manufacturers Boeing and Airbus.

The disputes date back to late 2019 when the Trump Administration hit the EU with import tariffs on $7.5 billion of goods following a World Trade Organization (WTO) ruling that Europe’s Airbus, Boeing’s main rival, received illegal subsidies between 2011 and 2018. The WTO authorizes punitive tariffs as retaliation to pressure a country to comply with a WTO ruling. In October 2020, the WTO determined Boeing had also received illegal subsidies, thus opening the door for the EU to hit the U.S. with import duties on $4.0 billion of U.S. goods.

The EU’s tariffs apply to all non-durum U.S. wheat entering the bloc. The tariffs have the biggest impact on HRS demand, the largest class of U.S. wheat sent to the EU besides durum. With the tariffs, HRS farmers lost competitive access to the EU, a considerable, consistent market. EU customers regularly import about 300,000 metric tons of HRS per marketing year, making the bloc a top-10 export destination for the Northern Plains wheat. The market disruption will also disrupt the routine of EU customers who have come to depend on the unique functionality of high protein HRS, unmatched by domestic varieties, for valuable products like holiday breads and pizza dough.

Punitive tariffs generated by competing WTO challenges on airplane manufacturing subsidies have disrupted trade in non-durum U.S. wheat, primarily hard red spring wheat (above) with European customers. 

Unfortunately, there is no termination date scheduled for either set of tariffs and agricultural trade between the United States and the EU will continue to suffer as a result. U.S. Wheat Associates (USW) encourages the United States and EU to prioritize a fair, timely solution to this trade dispute to reinforce the trusted partnership between U.S. farmers and our customers in the EU. In the meantime, USW will continue to monitor the situation and will regularly communicate with producers, customers and exporters about these developing uncertainties.


thumbnail

By Claire Hutchins, USW Market Analyst

USDA currently estimates the United States will export 26.5 million metric tons (MMT) of wheat in 2020/21, 1 percent ahead of last year’s pace, if realized. Five months into marketing year (MY) 2020/21, total U.S. wheat commercial sales are 12 percent ahead of last year’s pace at 16.8 MMT and are 15 percent ahead of the 5-year average.

To date, export sales of hard red winter (HRW), hard red spring (HRS) and white wheat (soft and hard) are significantly ahead of last year’s pace. Sales of soft red winter (SRW) and durum lag 2019/20. Success in individual markets such as China and Brazil due to policy changes and follow-on trade and technical service by U.S. Wheat Associates (USW) are supporting overall sales. As in other markets, competitive pricing for U.S. wheat early in MY 2020/21 helped fuel a faster import pace even by traditionally strong U.S. wheat buyers like the Philippines and South Korea.

HRW. Total HRW sales are 12 percent ahead of last year at 6.12 MMT. Stable exports to Mexico, Nigeria and Japan, the top three markets for HRW, and significantly stronger export programs to China and Brazil are supporting HRW sales in the first third of MY 2020/21.

As of Oct. 29, China has purchased 981,000 metric tons (MT) of HRW after no purchases in 2019/20. Strong HRW export sales so far in 2020/21 can be attributed to the Phase One agreement between the United States and China, as well as competitive HRW prices early in the marketing year. So far in MY 2020/21, China is the second largest market for HRW behind Mexico.

HRW export sales to Brazil are nearly two times more than this time last year at 513,000 MT and are 49 percent ahead of the 5-year average. According to Miguel Galdos, USW Regional Director, South America, the opportunity to advance sales to Brazil came with the Brazilian government opening a tariff rate quota (TRQ) allowing up to 750,000 MT of non-Mercosur (South America’s free trade bloc) wheat to enter the country tariff-free. Strong USW educational programs in Brazil are encouraging millers to take advantage of the high quality and competitive prices of U.S. wheat. To date, Brazil is the fifth largest market for HRW.

“USW provides the best trade and technical service to our customers and we are here for Brazilian mills for any need they have,” said Galdos.

Source: USDA FAS export sales data as of Oct. 29, 2020

HRS. Total HRS export sales of 4.72 MMT are 15 percent ahead of this time last year and are 8 percent ahead of the 5-year average. Sales to the Philippines, the top market for HRS, are 22 percent ahead of last year at 1.30 MMT and are 34 percent ahead of the 5-year average. Rising per capita consumption combined with population growth and competitive HRS prices early in the marketing year supported strong sales to the Philippines at the start of 2020/21.

In Japan, the second largest market for HRS, sales of 569,000 MT are up 20 percent on the year.

“We had good start this year in the Japanese market following the U.S. and Japan trade agreement implemented on January 1,” said Rick Nakano, USW Country Director, Japan. “This gives U.S. wheat a better opportunity to be traded on equal footing with similar classes of wheat from Canada. This results is a great outcome for U.S. wheat to compete equally again with Canadian wheat to meet the needs of Japan’s flour millers.”

Source: USDA FAS export sales data as of Oct. 29, 2020

White. Total U.S. white wheat sales are 41 percent ahead of this time in 2019/20 at 4.02 MMT and are 36 percent ahead of the 5-year average. In the Philippines, the largest market for U.S. soft white wheat, export sales are up 42 percent on the year and are 40 percent ahead of the 5-year average.

The increased demand by Philippine millers is partially due to early customer buying in response to tight export elevation capacity in the Pacific Northwest (PNW). Strong USW educational programs in the Philippines helped customers stay informed and make timely buying decisions in the first third of MY 2020/21.

Sales to South Korea, the second largest market for U.S. soft white wheat, are 79 percent ahead of last year’s pace and are 53 percent ahead of the 5-year average. Soft white wheat on a C&F (FOB and freight) landed basis to South Korea has been priced very competitively.

Looking ahead, Australia’s larger 2020 crop is coming to market and its prices are coming down. USDA predicts the 2020/21 Australian wheat crop will reach 28.5 MMT this year, 87% ahead of last year as beneficial rains pull the country out of a three-year drought.

Source: USDA FAS export sales data as of Oct. 29, 2020

SRW export sales are a different story. Total SRW export sales are down 26 percent on the year at 1.36 MMT, 21 percent behind the 5-year average. SRW export sales to all of the country’s top 10 overseas markets are behind last year’s pace.

“SRW prices are just too high right now,” said one grain trader, “the United States is priced out of the world market, especially to our buyers in Latin America and Nigeria.”

Between early June and late October, the average export price for SRW was $233/MT, 12 percent higher than the same period last year. Limited exportable supplies of SRW along the Mississippi River due to lower planted area in key states and extremely tight export elevation capacity in the Center Gulf due to increased export demand for soybeans and corn continue to support SRW export prices early in MY 2020/21.

Durum. Year-to-date durum sales in 2020/21 are 19 percent behind last year’s pace at 541,000 MT but are 30 percent ahead of the 5-year average. Total sales to Italy, the largest market for U.S. durum, are only 3 percent behind last year’s pace, but are 66 percent ahead of the 5-year average.


thumbnail

By Claire Hutchins, USW Market Analyst

USDA pegs 2020/21 world wheat production at a record 773 million metric tons (MMT), up 1% from last year and 3% above the 5-year average of 721 MMT. Total global supplies are forecast to reach a record 1,072 MMT, 2% more than last year. USDA projects significantly higher production in several of the world’s major exporting regions including Australia, Canada and Russia. Specifically, in Australia, production is expected to rebound 87% on the year to 28.5 MMT as favorable precipitation during the growing season pulled the country out of a severe, three-year drought. USDA estimates 2020/21 world wheat ending stocks will reach a record 321 MMT, up 7% from last year and 16% more than the 5-year average.

Higher global production and ending stocks are matched by increased global demand, lending confidence to the 26.5 MMT USDA forecast for the final 2020/21 U.S. wheat export volume. USDA expects total global consumption will reach a record 751 MMT this year, slightly higher than last year and 2% more than the 5-year average. Increased total global consumption is driven by a significant increase in human consumption which more than offsets reduced feed wheat use. Global human wheat consumption is expected to increase 2% on the year to a record 613 MMT. USDA expects global wheat trade to reach 190 MMT, slightly below last year’s record but 5% more than the 5-year average.

thumbnail

By Claire Hutchins, U.S. Wheat Associates Market Analyst

It is no secret that wheat futures prices have reached unexpected heights recently. Higher futures prices usually pressure export basis values when farmers sell wheat “into the rally” because that increases exportable U.S. wheat supplies. However, we are seeing a completely different phenomenon in the recent market. Extremely tight elevation capacity out of the Gulf and Pacific Northwest (PNW) due to massive U.S. agricultural commodity exports to China is sustaining high wheat export basis values, despite increased farmer selling.

CBOT soft red winter (SRW) futures and KCBT hard red winter (HRW) futures, specifically, have jumped over the past month beyond expected levels. Between Sept. 11 and Oct. 9, for example, CBOT SRW futures prices increased 11 percent to $5.94/bu, the highest since December 2014. Over the same period, KCBT HRW future prices jumped 13 percent to $5.36/bu, the highest since August 2018. MGE hard red spring (HRS) futures have increased too, by 6 percent since Sept. 11 to close at $5.44/bu on Oct. 9.

Source: DTN and USW Price Charting Tools

U.S. grain traders agree generally that the “run up” in futures prices is attributed to technical buying, where “managed money” or commodity funds buy significant amounts of U.S. wheat futures contracts with the expectation that the contracts will gain value over time. While not the whole story, part of this technical buying spree can be attributed to varying severities of dryness from Argentina to the U.S. Great Plains to the Black Sea.

These high export basis levels could hold on. “Increased farmer selling hasn’t made a dent on export basis,” said one grain trader. Limited elevation capacity is the reason.  That is because China has purchased 22.1 million metric tons (MMT) of U.S. soybeans, 9.98 MMT of corn and 1.48 MMT of wheat for delivery in 2020/21, as of Oct.1. Such demand causing “nearly non-existent” elevation capacity for wheat is sending export basis values higher.

“October, November and now nearly all of December are at capacity; we can’t add a lot more business for those months. If anyone were to sell anything for those delivery periods, it would raise elevation costs substantially more,” said another industry contact.

Additionally, export elevators are likely to charge more to elevate wheat in the next couple of months because they expect to store and export more corn and soybeans. It is more complex and expensive for export elevators to handle multiple commodities at the same time, said a representative from the U.S. grain trade.

Between June 5 and Oct. 9, Gulf HRS 14.0 percent protein export basis (on a 12 percent moisture basis) jumped 55 percent to $2.40/bu, Gulf HRW 11.5 percent protein export basis jumped 31 percent to $1.90/bu and Gulf SRW export basis jumped 80 percent to $1.35/bu.

Over the same period, PNW HRS 14.0 percent protein export basis increased 55 percent to end at $2.40/bu and PNW HRW 11.5 percent protein export basis increased 47 percent to close at $2.50/bu.

The two components of FOB are the futures price plus export basis so when both go up, the FOB prices jump substantially.

Between Sept. 11 and Oct. 9, Gulf HRS 14.0 percent protein FOB jumped 6 percent to end at $288/MT, the highest since June 2018. Gulf HRW 11.5 jumped 9 percent to close at $267/MT, the highest since December 2014. SRW increased 11 percent to end at $277/MT, the highest in over five years.

Over the same period, PNW HRS 14.0 percent protein increased 7 percent to close at $288/MT, the highest since May 2018, and PNW HRW 11.5 percent protein jumped 9 percent to end at $289/MT, the highest in more than five years.

What does this mean moving forward?

While U.S. Wheat Associates (USW) does not have a crystal ball, based on our information, we expect  export basis levels will stay at these higher levels through January assuming Chinese buying remains strong.  Futures prices could come down off their recent rally if, for example, “managed money” reverses its long position in wheat futures, but there would have to be a significant downward correction to take pressure off current FOB values.

thumbnail

Variable growing conditions greatly influenced the 2020 U.S. hard red winter (HRW) wheat crop. In areas with favorable growing conditions, record yields resulted in lower protein but excellent test weights and kernel characteristics, while regional swings in temperature and moisture led to lower yields with higher protein. The result is a crop that has generally outstanding kernel characteristics with flour, dough and bake quality attributes equal to or better than last year and many of the 5-year averages. Overall, the 2020 HRW crop can be characterized as clean and sound with good milling and processing characteristics, providing customers with an exceptionally good range of quality and value.

U.S. Wheat Associates (USW) has posted the full 2020 Hard Red Winter Regional Report on its website here, as well as the 2020 California Hard Red Winter Regional Report here.

USDA estimates the 2020 HRW planted area was again near historic 100-year lows, continuing the trend of recent years. Total HRW production is estimated at 17.9 MMT (695 mil bu), a 4.8 MMT (174 mil bu) decrease from 2019. Growing conditions varied among the HRW production regions.

  • The western Central and Southern Great Plains experienced insufficient moisture, freeze events and high temperatures during key stages of crop development, resulting in lower yields and kernel size, but higher protein.
  • The eastern Central and Southern Great Plains experienced favorable growing conditions resulting in record yields and very good kernel characteristics, but lower protein.
  • The Northern Great Plains and Pacific Northwest also experienced variable growing conditions. Washington, Montana and South Dakota harvested crops are equal to or better than average with very good kernel characteristics and protein. However, Oregon experienced a significant reduction in yield due to unseasonably dry weather.

With very few exceptions disease and insects were not a major issue for the 2020 HRW crop.

Here are highlights of data from the 2020 HRW wheat crop.


Wheat and Grade Data:

  • Grade – the overall average is U.S. No. 2 or better.
  • Test Weight average of 61.4 lb/bu (80.8 kg/hl) is above 2019 and the 5-year averages.
  • Dockage, total defects and foreign material averages are all equal to or similar to 2019 and the 5-year averages.
  • Wheat Protein (11.9%, 12% mb) and shrunken and broken (1.1%) are above 2019 and the 5-year averages.
  • 1000 Kernel Weight averages at 31.2 g, which is less than 2019 but higher than the 5-year average.
  • Wheat Falling Number – Average of 369 sec, indicative of sound wheat.


Flour and Baking Data:

  • Laboratory Mill Flour Extraction average is 73.5%, lower than the 2019 and 5-year averages of 74.5% and 75.4%, respectively.
  • Flour Ash levels of 0.49% (14% mb) is comparable to last year but lower than the 5-year average.
  • Alveograph W value of 261(10-4 J) is significantly higher than last year and the 5-year averages.
  • Farinograph peak and stability times, 5.3 and 10.3 min, respectively, are higher than the 2019 and the 5-year averages. Average bake absorption is 63.1%, also above the value for 2019 and the 5-year average.
  • Loaf volume averaged 859 cc, comparable to last year’s and the 5-year averages.

Buyers are encouraged to review their quality specifications to ensure that their purchases meet their expectations.


View other summaries of the 2020 U.S. wheat crop:
Hard Red Spring
Hard White
Soft White
Soft Red Winter
Durum

View the full 2020 U.S. Crop Quality Report and other related resources here.