Whether it is for noodles in Asia, bread in South America or cookies in North Africa, once U.S. wheat leaves the farm, the journey it will go on has only just begun. The choices U.S. wheat farmers make when growing their wheat plays a big role in that journey but they seldom see exactly how their practices impact those overseas markets and end-products. Every year USW sends teams of U.S. farmers overseas to visit markets they supply with wheat. These regional visits highlight the day-to-day work and marketing strategies of USW’s overseas offices and connect the farmers to their customers and industry stakeholders. Earlier this year, USW’s first 2017 board team travelled to Thailand and the Philippines.
“The purpose of these teams is to give U.S. wheat farmers a better understanding of the wide variety of markets and issues that USW works on to position the benefits of importing U.S. wheat,” said USW Deputy Director of the West Coast Office Shawn Campbell. “We aim to better educate growers on the challenges they face in marketing their wheat overseas, so they can make decisions at home and with their state wheat commissions that are focused on meeting customer needs.”Campbell will lead USW’s 2017 Latin America Board Team to Mexico, Haiti, Ecuador and Chile this month. The team includes: Eric Spates, a wheat farmer from Poolesville, MD, and a member on the Maryland Grain Producers Utilization Board; Rachael Vonderhaar, a wheat farmer from Camden, OH, and a member on the Ohio Small Grains Marketing Group; and Ken Tremain, a wheat farmer from LaGrange, WY, and a member of the Wyoming Wheat Marketing Commission.
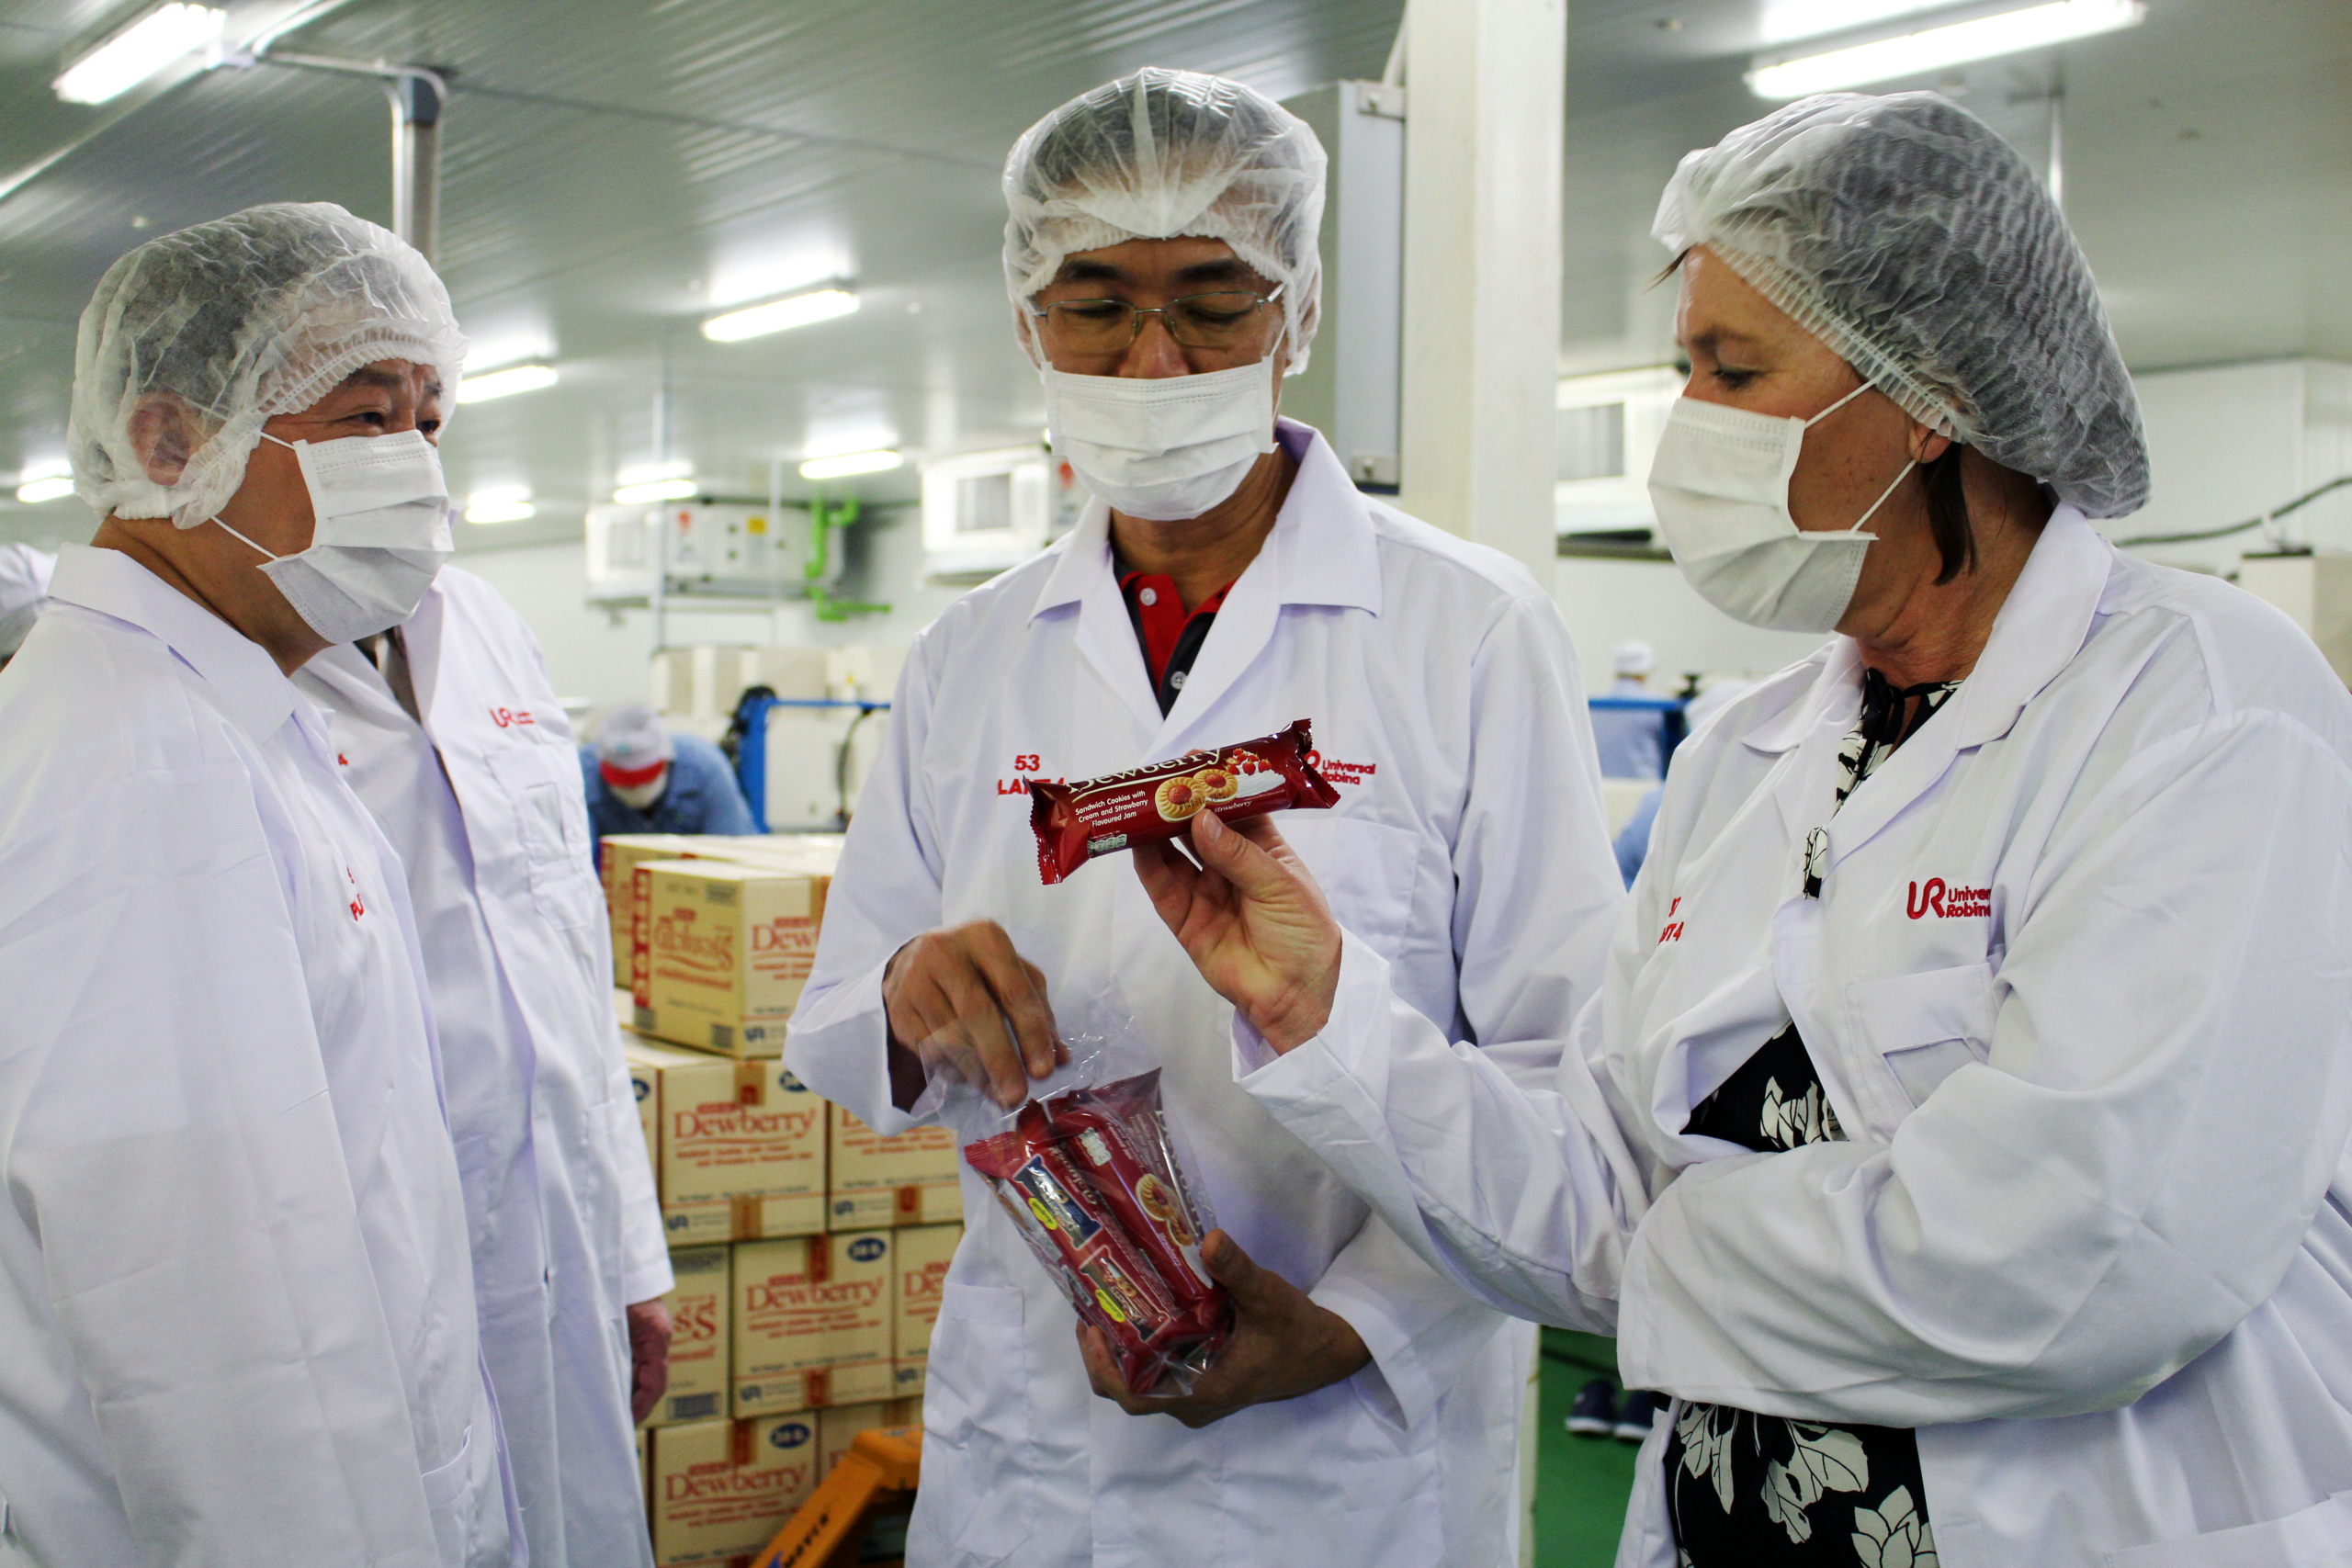
The team will first meet at the USW Headquarters in Arlington, VA, for briefings, then visit USDA/FAS and the Federal Grain Inspection Service offices in Washington, DC. The team will then head to Mexico and Haiti for five days, followed by six days in South America with stops in Ecuador and Chile. The team will tour multiple mills and international food manufacturing plants, as well as an industrial equipment supplier, and they will meet with groups such as Seaboard and ASEMOL, the Ecuadorian Millers Association and Caribbean Milling. Throughout the course of the trip, the team will connect with staff from the USW Mexico City, Mexico, and Santiago, Chile, regional offices.
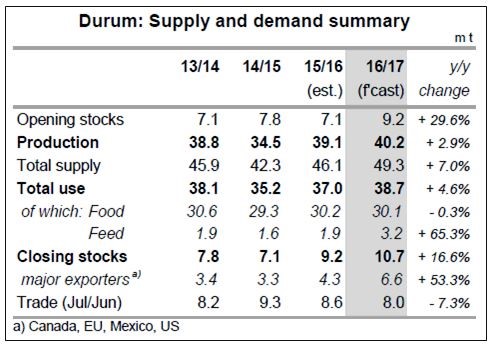
Latin American countries import 40 percent of all U.S. wheat exports, yet U.S. wheat faces growing competition in the region due to changes in laws affecting grain exports, as well as rebounding domestic wheat production that brings a new, large-scale source of lower value wheat into the marketplace. Due to its geographic location, consistency, and a preferential trade agreement, Mexico is the largest customer of U.S. wheat in the world so far in 2016/17 and is the second largest customer on average over the last five years. Year to date, Mexico is also the top buyer of U.S. soft red winter (SRW) wheat and HRW wheat.
Haiti, on the other hand, is a much smaller and more price sensitive market, versus the other quality oriented markets that the team will visit. In South America, Ecuador represents a moderate size market that is willing to pay for quality, but U.S. wheat faces strong competition. U.S. wheat holds the majority market share in Chile, but it is still a market where the United States is increasingly facing competition. USW has maintained close, long-term relationships with regional industry leaders through an office established in Santiago in 1978 and by providing technical and trade servicing in Mexico for more than two decades.
“These four markets represent buyers that USW staff work closely with each day,” said Campbell. “The farmers will gain a unique look at the value of using high quality U.S. wheat and why these markets increasingly prefer it for their end-products.”The team will post regular travel updates and photographs, and will report to the USW board later this year. Follow their progress on the USW Facebook page at www.facebook/uswheat and on Twitter at @uswheatassoc.