By Stephanie Bryant-Erdmann, USW Market Analyst
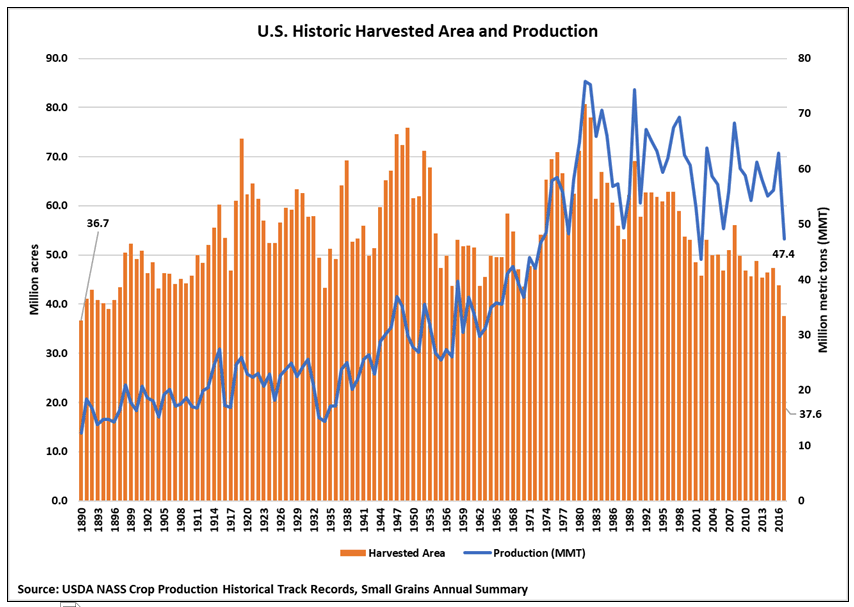
USDA’s Sept. 30 Small Grains Summary reported that U.S. farmers harvested 37.6 million acres (15.2 million hectares) of wheat for the 2017/18 crop, a 14 percent reduction from 2016/17 and the smallest harvested area since 1890. USDA estimated U.S. 2017/18 wheat production at 47.4 million metric tons (MMT) (1.74 billion bushels), down 25 percent year over year and 15 percent below the 5-year average. The smallest planted area since USDA record began in 1919, adverse weather conditions and wheat streak mosaic virus all contributed to reduced harvested area.
The largest beginning stocks since 1988/89 will partially offset lower production. USDA expects 2017/18 U.S. beginning stocks to total 32.2 MMT (1.18 billion bushels), up 21 percent year over year and 57 percent greater than the 5-year average. Total 2017/18 U.S. wheat supply is forecast at 79.6 MMT (2.92 billion bushels), down 11 percent from 2016/17 but in line with the 5-year average. Despite the sharp year over year reduction in yields, USDA expects the final average yield to reach 46.3 bu/acre (3.11 MT/ha), similar to the 5-year average of 46.6 bu/acre (3.13 MT/ha).
Last fall, low farm gate prices and large carry-in stocks prompted U.S. farmers to plant 32.7 million acres (13.2 million hectares) of winter wheat, down 9 percent from 2016/17. The winter wheat crop went into winter dormancy in good or above average condition. A mild winter and early spring was beneficial for both winter wheat and, unfortunately, the mites that carry wheat streak mosaic virus. The disease was widespread in Kansas, Oklahoma and parts of Nebraska, cutting yields and causing higher rates of abandonment in affected hard red winter (HRW) areas. A late spring blizzard in western Kansas cut yields and increased abandonment. Soft red winter (SRW) generally came out of dormancy in better than normal conditions, but growing conditions also varied widely across the Southeast. In some areas, excessive moisture helped boost yields, in others it delayed or prevented emergence.
As with winter wheat, low spring wheat and durum farm gate prices and large carry-in stocks reduced planted areas. After planting (which is generally early), drought conditions spread across Montana, North Dakota and South Dakota with devastating effects on yield. As a result, the rate of abandonment in South Dakota, which was particularly hard hit, is estimated at 37 percent — nearly triple the state’s 5-year average.
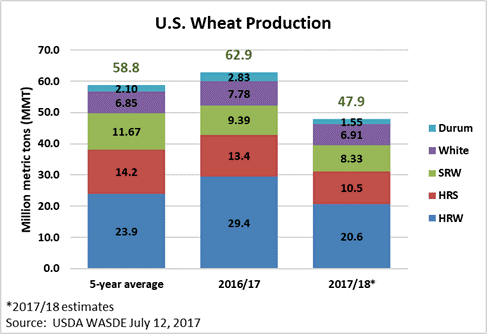
Here is a by-class breakdown of the Sept. 30 report.
Hard Red Winter (HRW). USDA estimates total 2017/18 HRW production fell to 20.4 MMT (750 million bushels), down 31 percent from 2016/17 and 15 percent below the 5-year average. USDA forecast 2017/18 HRW beginning stocks at 16.1 MMT (593 million bushels), up 33 percent year over year and 81 percent above the 5-year average. Even with large beginning stocks, total HRW supply will fall 12 percent year over year to 36.5 MMT (1.34 billion bushels). Total HRW planted area fell to 23.8 million acres (9.63 million hectares), down 10 percent from 2016/17. Yields also fell an average 13 percent from 2016/17 in the top HRW-producing states of Texas, Oklahoma and Kansas.
Hard Red Spring (HRS). USDA estimates total 2017/18 HRS production fell to 10.5 MMT (385 million bushels), down 22 percent from 2016/17 and 26 percent below the 5-year average. USDA forecast 2017/18 HRS beginning stocks at 6.40 MMT (235 million bushels), down 14 percent year over year but still 21 percent above the 5-year average. Total HRS supply will fall 12 percent year over year to 16.9 MMT (620 million bushels). USDA estimates farmers planted 10.3 million acres (4.17 million hectares) to HRS, 10 percent below 2016/17 levels. The drought cut yields an average of 11 bu/acre (0.74 MT/ha) in Montana, North Dakota and South Dakota. Abandonment in Montana and North Dakota was double the respective 5-year averages at 9 and 6 percent, and South Dakota farmers abandoned 37 percent of wheat fields due to the drought. The single bright spot for HRS production was Minnesota, with a record high average yield of 67.0 bu/acre (4.50 MT/ha) offsetting lower harvested area.
Soft Red Winter (SRW). USDA estimates total 2017/18 SRW production fell to 7.95 MMT (292 million bushels), down 15 percent from 2016/17 and 32 percent below the 5-year average. USDA reported 24 percent of SRW acres were abandoned compared to 17 percent last year. Record high yields in six SRW producing states partially offset the lower harvested area. USDA forecast 2017/18 SRW beginning stocks at 5.85 MMT (215 million bushels), up 37 percent year over year and 47 percent greater than the 5-year average. So, total SRW supply will rise slightly year over year to 13.8 MMT (507 million bushels). USDA estimates total 2017/18 SRW planted area at 5.61 million acres (2.27 million hectares), 15 percent lower than 2016/17 and 30 percent below the 5-year average.
Soft White (SW). USDA estimates total 2017/18 SW production declined to 6.14 MMT (226 million bushels), down 11 percent from 2016/17 due to small declines in harvested area and average yields in Washington and Idaho that were down 7 and 10 percent, respectively. USDA reports white wheat planted area decreased 3 percent year over year. White wheat planted area fell to 4.02 million acres (1.63 million hectares), 2 percent below the 5-year average. USDA projected white wheat beginning stocks will increase 42 percent year over year to 3.02 MMT (105 million bushels). If realized, that would be 65 percent above the 5-year average.
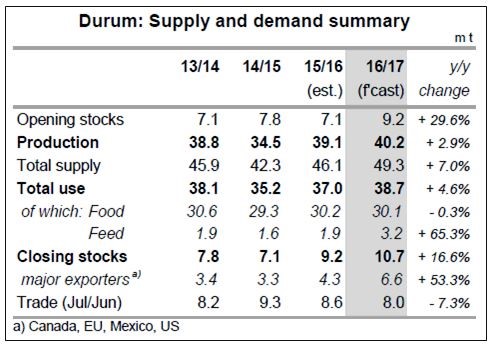
Durum. U.S. durum production fell 51 percent in 2017/18 to 1.49 MMT (54.9 million bushels) from lower planted area and yields in Montana, North Dakota and South Dakota. USDA estimates 1.91 million acres (773,000 hectares) were planted to durum, down 11 percent from 2016/17 but still 6 percent above the 5-year average of 1.80 million acres (729,000 hectares). Abandonment also increased this year from 2 percent in 2016/17 to 8 percent in 2017/18, due to the drought. USDA projected 2017/18 durum beginning stocks to climb to 980,000 metric tons (MT) (36 million bushels), nearly double the 5-year average and 29 percent above 2016/17 levels. USDA forecast total U.S. durum supply at 2.48 MMT (91 million bushels), down 31 percent year over year.