Each year, on March 31, those who grow, trade or import U.S. agricultural commodities look to USDA’s annual Prospective Plantings and Quarterly Grain Stocks Report for indications of potential price movements. The consensus from analysts across the industry on how this week’s reports will affect wheat markets is generally bullish.
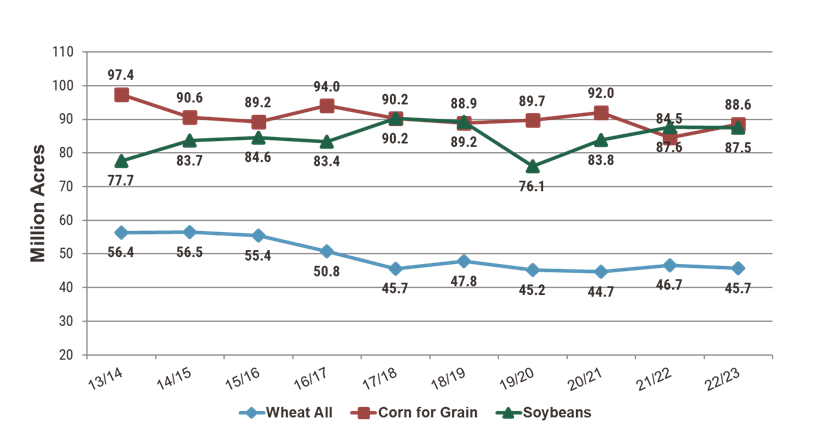
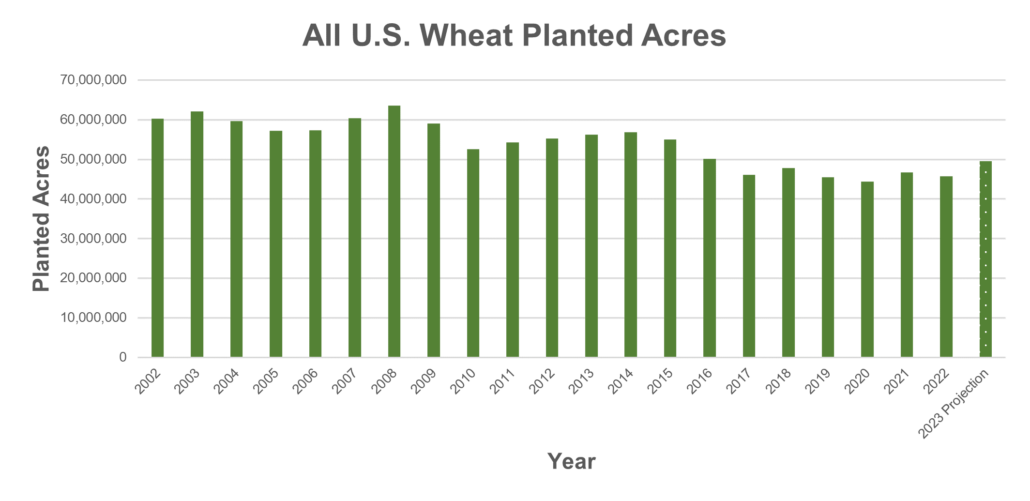
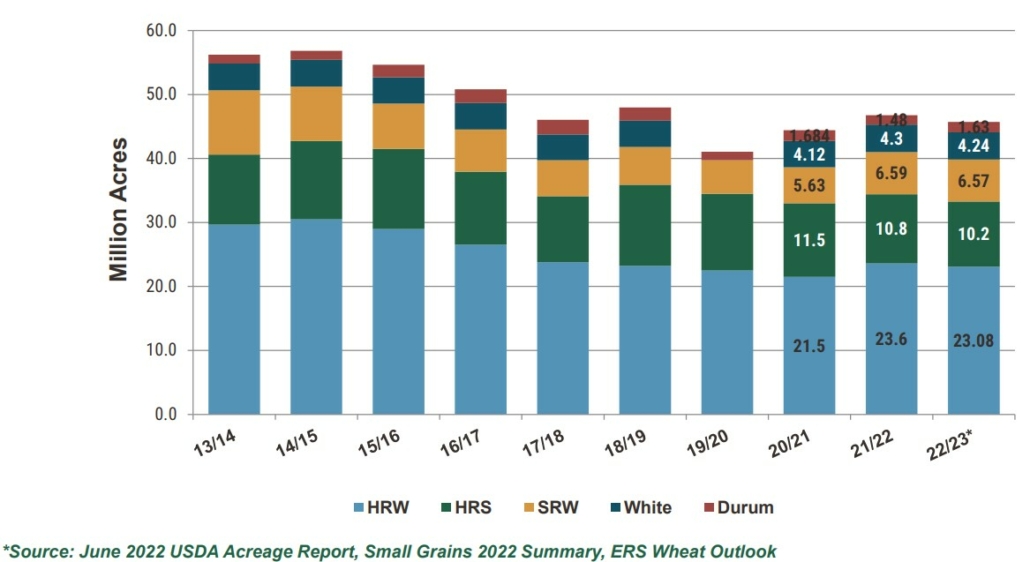
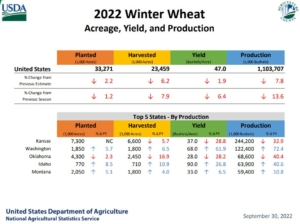
For reference, in its January 2023 Wheat Outlook report, USDA estimated total U.S. winter wheat planted area for 2023/24 at 37.0 million acres (14.9 million hectares), up 11% from last year to the highest level since 2015/16. The hard red winter wheat (HRW) area was up 10% to 25.3 M/ac (10.2 M/ha), while white winter wheat is up by 3% to 3.73 M/ac (1.5 M/ha). soft red winter wheat (SRW) experienced the most significant increase, jumping 20% from 2022/23 to 7.9 M/ac (3.2 M/ha). USDA’s February Grains and Oilseed Outlook projected an 8% increase in all wheat planted area to 49.5 M/ac (20.0 M/ha)
U.S. Wheat Associates (USW) compiled the following pre-report perspectives.
Analysts See Lower Planted Area
Bloomberg recently surveyed more than 30 agricultural analysts about their prospective plantings estimates for wheat, corn, soybeans and other crops. The average estimate for the total wheat area came in slightly below USDA’s January estimate at 48.9 M/ac. The average winter wheat estimate was 36.3 M/ac, also less than USDA’s 37.0 M/ac. Spring and durum wheat average among the analysts Bloomberg surveyed was 10.9 M/ac for HRS and 1.7 M/ac for durum.
Back in January, agricultural consulting firm Farmers Business Network surveyed U.S. winter wheat farmer members of the organization about their planting intentions. The results showed planted area increases for HRW and SRW, with all U.S. winter wheat planted area seen at 34.2 M/ac for 2023/24, up 900,000 ac compared to their 2022 survey. That is significantly lower than USDA’s 37.0 M/ac January estimate.
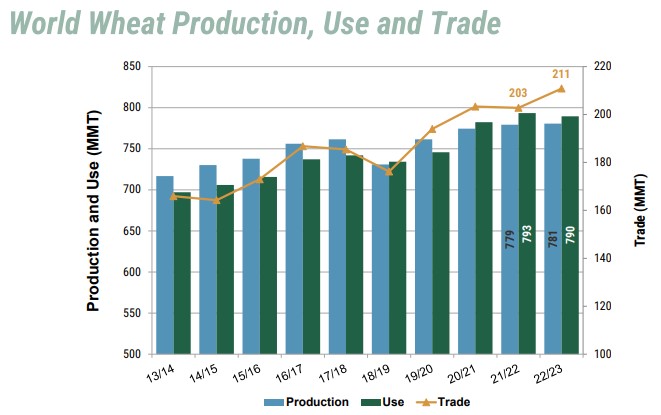
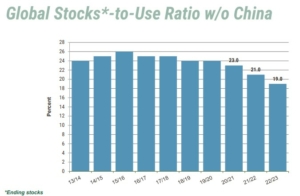
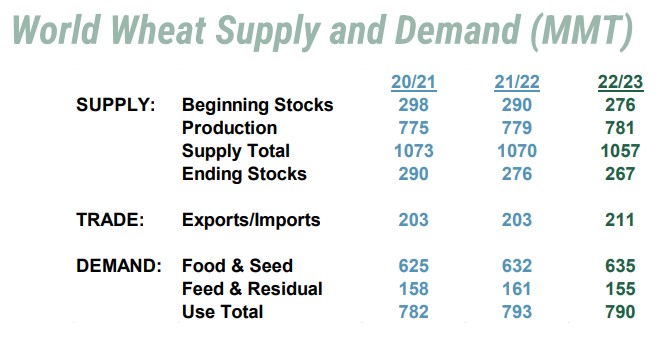
Balance Sheet Tightening?
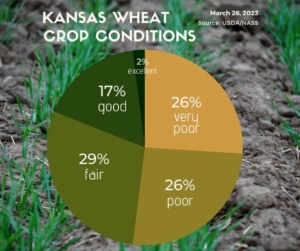
Kansas wheat crop conditions in late March reflects the impact of on-going drought in the western and central areas of the state.
While both Bloomberg’s and FBN’s surveys estimate of winter wheat planted area are up compared to the 2022/23 estimates, FBN Senior commodity Analyst Rejeana Gvillo said U.S. planted is “not large enough to shift the undertone of shrinking global wheat supplies. Given the acreage outlook, the drought in the Southern Plains will need to be broken come spring or summer or the U.S. wheat balance sheet could tighten further.”
Sadly, the drought has not broken in southwest Kansas, southeast Colorado, the northern Texas Panhandle, and the western Oklahoma Panhandle. There has been some easing of drought outside that hard-hit area. Justin Gilpin, CEO of Kansas Wheat does not anticipate major adjustments to USDA’s winter wheat planted area, but he is looking to other farmer decisions ahead.
“Last year, USDA began inching Kansas winter wheat acreage lower in the March report. I expect any changes or adjustments this year to be in the other direction, with slightly higher planted winter wheat acres in Kansas,” Gilpin said, which includes SRW in eastern Kansas. “But any incremental changes at this point are overshadowed by what the harvested acres might be with expected higher abandonment due to the drought conditions and poor stands in southwest Kansas.”
Spring Wheat Planting Delay?
Drought is not the problem in the Northern Plains HRS and durum region. This has been a very wet and cold winter with persistent snow cover.
“Everybody’s pretty much thinking it is going to be a late start” to planting, said Randy Martinson of Martinson Ag Risk Management in a story posted by AgWeek, Fargo, N.D.
On the Agweek Market Wrap, March 24, Martinson said with two feet of snow or more in places in the region and a forecast for little warm up in sight, some farmers already are considering looking for earlier maturing varieties and “questioning whether they should still plan to plant spring wheat.”
Asked about the Prospective Plantings report on March 31, Martinson added that the consensus among farmers he has talked to is there will be more corn and soybeans planted and less spring wheat, though more winter wheat already has been planted. However, he said there likely will be changes depending on how the spring shapes up.
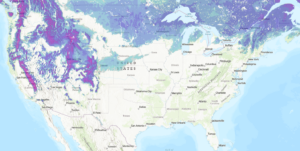
Snow cover in late March is still 10 inches to almost 30 inches deep in parts of U.S. HRS growing regions of South Dakota, North Dakota and Montana. Delayed planting may shift some spring wheat area to other crops this year. Source: USDA Forest Service.
Buy Signals for Speculators
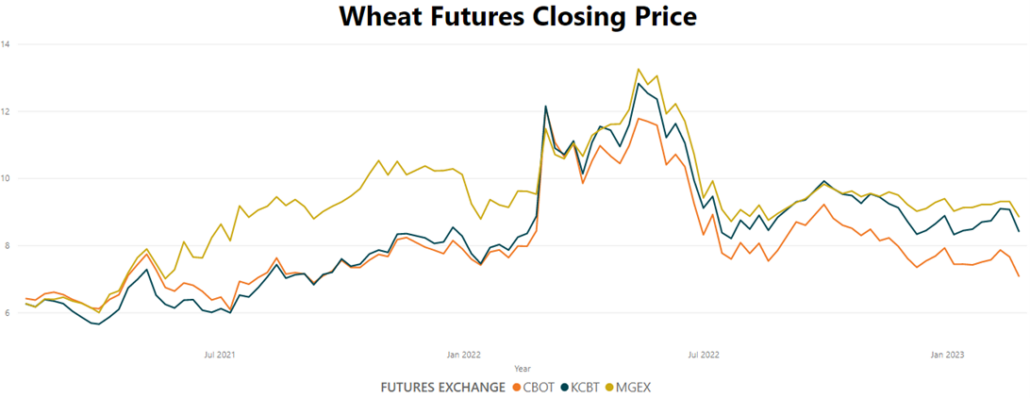
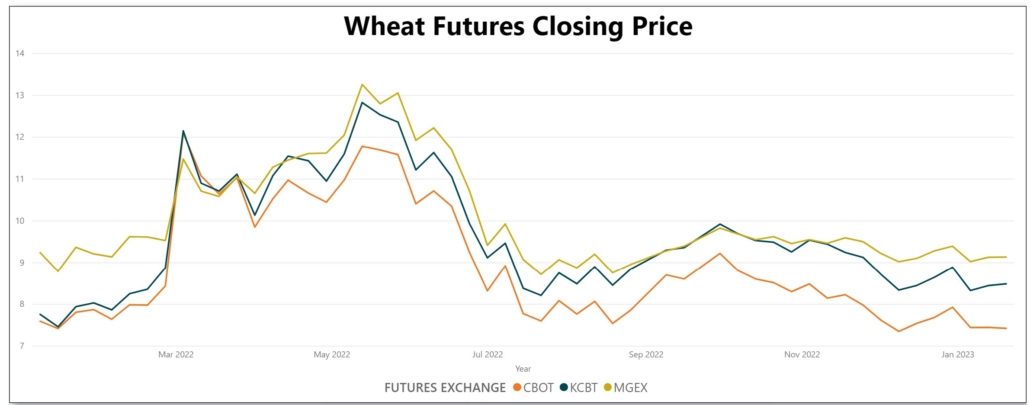
Commercial traders and futures speculators are getting the same information. Barchart analyst Sean Lusk wrote this week that the market is net short in Chicago SRW wheat futures as the plantings and stocks reports are coming on the same day as the month and quarter end. He expected managed money to take profits by buying wheat into the weekend.
In the end, USW believes Martinson is correct in saying the weather and the planting report will be the market movers this week.