By Stephanie Bryant-Erdmann, USW Market Analyst
Six months into marketing year 2017/18 (June to May), total U.S. export sales of 19.5 million metric tons (MMT) are 8 percent behind last year’s pace according to USDA Export Sales data through Jan. 4. However, the estimated total value of U.S. wheat export sales is 4 percent greater than last year on the same date at $4.72 billion, due to slightly higher export prices according to USDA Export Sales data and USW Price Report data.
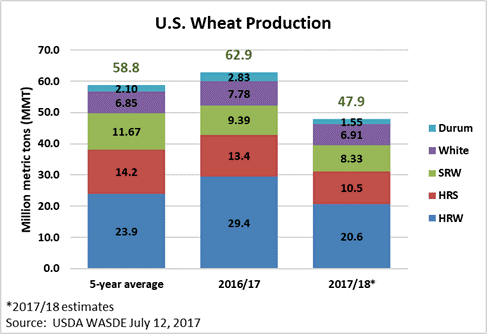
A deeper analysis of USDA data shows total sales to six of the top 10 U.S. export markets in 2016/17 are ahead of last year’s pace, demonstrating strong demand for U.S. wheat. Sales of soft red winter (SRW) and soft white (SW) are both ahead of last year’s pace. USDA projects total 2017/18 exports will fall slightly to 26.5 MMT, which, if realized, would be 8 percent below 2016/17 but 1 percent above the 5-year average pace.
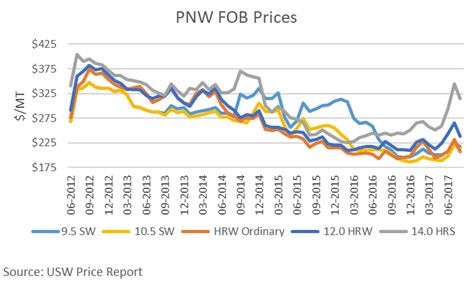
USDA reported hard red winter (HRW) year-to-date exports at 7.79 MMT, down 10 percent from the prior year. Still, 2017/18 export sales are 10 percent ahead of the 5-year average due to competitive prices for medium protein HRW and the good, overall quality of this year’s crop. The estimated value of year-to-date HRW export sales is 6 percent above 2016/17 due to a 14 percent increase in the average U.S. HRW free-on-board (FOB) price that is supported by the increased premiums for HRW with higher protein. Mexico is currently the number one HRW purchaser. As of Jan. 4, HRW sales to Mexico totaled 1.58 MMT, up 28 percent from last year’s pace. Sales to Indonesia are also up 28 percent year over year at 430,000 metric tons (MT). HRW purchases by Algeria total 456,000 MT, more than double last year’s sales on this date. To date, HRW sales to Venezuela totaling 120,000 MT are nearly four times great than the 2016/17 pace.
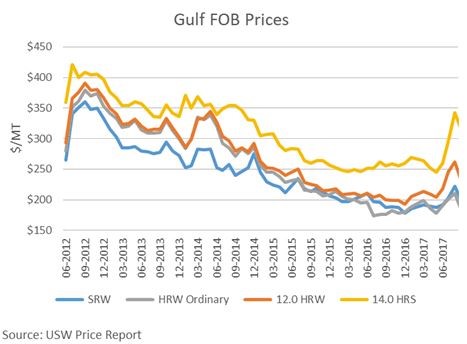
Both export sales volume and value of SRW for 2017/18 are up due to the excellent quality of this year’s crop and relatively competitive pricing. Export sales are up 7 percent year over year at 2.02 MMT, boosting estimated export sales value to $400 million, or 12 percent more so far this year. As of Jan. 4, total sales to 11 of the top 20 U.S. SRW export markets from 2016/17 are higher than last year. Sales to Colombia are 12 percent ahead of 2016/17 at 198,000 MT. Nigerian SRW purchases total 234,000 MT, up 12 percent from last year. Sales to other Central and South American countries, including Brazil, Peru, Panama, Venezuela and El Salvador, are also ahead of the 2016/17 pace.
Hard red spring (HRS) sales of 5.15 MMT are down 25 percent year over year and 7 percent below the 5-year average. Higher prices due to smaller 2017/18 production have slowed HRS exports thus far in 2017/18, but global demand for HRS is strong. Year-to-date in 2017/18, the average FOB price of HRS is $293 per metric ton ($7.97 per bushel), compared to $241 per metric ton ($6.55/bu) in 2016/17, according to USW Price Report data. As of Jan. 4, buyers in Japan purchased 878,000 MT, up 20 percent from 2016/17. Sales to Taiwan of 518,000 MT are up 17 percent from last year’s sales on the same date. The Philippines continues to import the largest volume of HRS, though at a 6 percent slower pace so far.
As of Jan. 4, exports of soft white (SW) wheat are up 22 percent year over year at 4.30 MMT. That is 28 percent greater than the 5-year average. Sales to the top 10 SW customers are ahead of last year’s pace, supporting an estimated export value of $896 million, up 25 percent from the prior year. Philippine millers purchased 946,000 MT, up 16 percent compared to last year’s sales on the same date. South Korean sales are up 43 percent at 674,000 MT. U.S. SW sales to China, Thailand and Indonesia are also up. Year-to-date, Indonesia has purchased 515,000 MT, compared to total 2016/17 purchases of 270,000 MT. Thailand sales are up 18 percent year over year at 217,000 MT. Chinese purchases of 306,000 MT are already greater than 2016/17 total SW sales.
Year to date durum exports total 272,000 MT, down 32 percent from the same time last year, and below the 5-year average, with tighter supplies and resulting higher prices. The average export price for U.S. durum is up 5 percent over last year at this time according to USW Price Report data. To date, Nigeria, the European Union (EU), Algeria and Guatemala are the top durum buyers. A significant portion of the first quarter 2017/18 sales is designated as “sales to unknown designations.