thumbnail

Mexico, Central America, the Caribbean, and South America represent a substantial portion of U.S. wheat sales, accounting for around 33% of all U.S. wheat exports. Due to proximity and sophisticated, quality-focused markets, Latin America and the Caribbean see competitive advantages in U.S. wheat supplies. In fact, while total demand for U.S. wheat slowed the last two years, sales to Latin American countries increased.

This trend signifies the value of U.S. wheat to customers throughout the region. This article will analyze the recent trends in Latin American markets and highlight current opportunities for U.S. wheat importers based on their patterns.

Looking Back

In the marketing year (MY) 2022/23, South American wheat imports were 1.6 MMT, up 29% from MY 2021/22, while U.S. wheat exports decreased by 2% from the prior year and were 17% below the five-year average. On a country level, significant sales increases were observed in Chile, Ecuador, and Brazil, among others.

Despite high prices, customers in Latin America and the Caribbean continued seeing the value in U.S. wheat classes, particularly soft red winter wheat (SRW). SRW sales were up 28% from the year prior and 31% above the five-year average regionwide.

This is a bar chart showing sales of U.S. SRW wheat to Latin American countries for 2022 and 2023 showing increased demand.

SRW exports increased in several Latin American countries in MY 2022/23. Sales were up 361% in Ecuador, 128% in the Dominican Republic, 99% in Honduras, 50% in Nicaragua, and 130% in Venezuela. Source: USDA FGIS Export Data.

Emphasis On Value

Moving into MY 2023/24, SRW remains an excellent value. The latest U.S. Wheat Associates (USW) Price Report put U.S. SRW at $249/MT FOB, competitively priced with other origins. Despite the recent volatility in wheat markets, SRW prices remain at their lowest level since the summer of 2021, and wheat futures have just breached the $6.00/bu threshold.

This line chart shows how U.S. SRW and soft white wheat export prices have declined of the past year.

SRW prices have hovered at their lowest level since July 2021. Harvest pressure and the above-average production weighs on the export basis and CBOT futures. Source: U.S. Wheat Associates Price Report.

Sales of SRW are tracking above last year’s pace. The most recent commercial sales put SRW commitments at 1.6 MMT, and the majority of this increase can be attributed to purchases from Latin American and Caribbean customers. In South America, SRW purchases are up 37%, while total U.S. wheat sales are down 34% in the region.

The August World Agricultural Supply and Demand Estimates put SRW exports at 3.7 MMT, up 26% from the year prior and up 37% from the five-year average.

This line chart compares the export price of U.S. soft red winter (SRW) wheat to competing supplies from Russia, Australis, Canada and France.

SRW has become competitive with other world suppliers. As of August 15, SRW was near parity with 12.5% (dry matter basis) Russian wheat. Source: AgriCensus Price Data and the U.S. Wheat Associates Price Report.

Risk Management is Vital

As mentioned in previous articles, the war in the Black Sea is a continued risk in the world wheat market. Though risk premiums have been eroded and the market appears to have reached some level of “comfort” with the war, prices can spike in an instant, especially as fighting has intensified in the weeks since the dissolution of the Black Sea Grain Agreement.

As seen in commercial sales to many Latin American customers, SRW demonstrates an excellent value as a high-quality and competitively priced soft wheat. Nevertheless, with the potential for more upside risk than a downward opportunity for SRW and all U.S. wheat classes, importers must watch market conditions closely to maximize SRW’s value in their blends. Your local USW office will be an important partner in this effort.

By Tyllor Ledford, USW Market Analyst

thumbnail

Just one year ago, U.S. wheat prices hovered near record highs. The geopolitical ramifications of Russia’s invasion of Ukraine stoked supply concerns and fears of spiraling food price inflation, and India had just banned wheat exports, further fueling wheat supply fears.

Flash forward to the week of May 2, 2023, Chicago Board of Trade soft red winter wheat (SRW) futures traded at their lowest level since March of 2021 at $5.95/bushel, earning that class the elusive honor of being the cheapest wheat on the world market.

After months of high prices, SRW and soft white (SW) classes have finally become more price competitive, providing a buying opportunity for importers. In this article, we will look in-depth at the market conditions for U.S. soft wheat classes and the factors influencing the entire market.

U.S. soft white wheat futures prices.

U.S. wheat prices retreated significantly the week of May 5 to touch near two year lows before ending slightly higher, demonstrating how quickly price sentiment can shift, though soft red winter wheat prices have trended lower. Source: U.S. Wheat Associates Price Charting Tool.

Competitive U.S. Soft Wheat Classes

Looking back, the U.S. soft wheat classes were poised to be more competitive thanks to several positive supply-side factors. Last year, both SW and SRW registered above-average production. The SW harvest came in at 4% above the five-year average and 35% above the drought-afflicted 2021/22 crop, while SRW was 16% above the five-year average, even boasting two large crops at 9.8 MMT in 2021/22 and 9.1 MMT in 2022/23.

Moreover, heading into marketing year 2023/24, the production outlook for SRW and SW remains positive. According to the USDA Prospective Plantings Report, SRW planted area increased 18% to 7.8 million acres (3.1 hectares), while white wheat plantings are estimated up 2% at 4.33 million acres (1.75 million hectares). The combination of good production last year and a positive outlook for the 2023 crop helped position SW and SRW to capture demand and remain competitive on the world market.

With the production bump and increased global competition, U.S. soft wheat prices have steadily decreased in the last few weeks. For a brief moment on May 2, U.S. SRW was the cheapest wheat in the world, coming in on average $10.00/MT FOB less than French wheat, $14.00/MT less than Russian wheat, and $13.00/MT less than Ukrainian. As a result, the U.S. Wheat commercial sales recorded 145,000 MT of SRW last week, the entire quantity likely bound for China. Meanwhile, SW wheat FOB prices hovered at $275.00/MT compared to $288.00/MT for Australian Standard White.

U.S. soft white wheat FOB export prices.

U.S. soft wheat prices have trended lower in search of demand. Soft white wheat prices have decreased by 39% since April 2022, while SRW has dropped by 45%. Even since the start of 2023, prices have come down 12% and 18%, respectively. Source: U.S. Wheat Associates Price Report

Underlying Bearish Market Factors

In addition to the positive supply outlook for soft wheat classes, recent bearish market factors have also been at play, influencing all U.S. wheat class prices. Last week hard red spring (HRS hit a nearly two-year low of $7.58/bu while hard red winter wheat (HRW) breached the $8.00/bu barrier to close at $7.71/bu. Seasonal influences also contribute to a fall in prices, especially for the soft wheat classes with a looser balance sheet and optimistic production outlook. Farmers and exporters will need to clear out their bins as new crop approaches to make room for the upcoming harvest.

Additionally, In the last two weeks, rain has fallen on some of the most drought-afflicted areas of the U.S. Southern Plains. Before these showers, it had been over 270 days since 0.25 inches of moisture (6.35 mm) had been recorded in some areas. The rains helped relieve some price pressure as the market assessed the moisture’s impact on drought conditions in the HRW growing region.

Beware The Bull

Demonstrated by this week’s jump in futures prices from the previous week’s lows, bullish influences are always lurking, especially as the Black Sea conflict continues to be an unpredictable bullish influence. As the Black Sea Grain Initiative approaches its May 18 expiration date, the longevity of the corridor hinges on Russia’s continued cooperation.

Furthermore, though the major HRW growing region in the Southern Plains received needed rains, there is concern about its impact. Some say the showers were “too little too late” for the crop as many fields already face abandonment.

Map of NOAA's prediction of long-term drought showing how U.S. soft white wheat is outside of the drought area.

Despite the rains in the U.S. Southern Plains, drought persists throughout the central HRW growing region. The recent showers helped improve soil moisture but not enough to reverse the drought impacts. Source: U.S. Department of Agriculture Drought Monitor.

Key Takeaways

This week’s price movements are just the latest example of how quickly market sentiment can shift, especially with influences as unpredictable as the weather and the war in Ukraine. Amidst the persistent market volatility, buyers must be wary of the market trends and be positioned to take advantage of every buying opportunity. As always, U.S. Wheat Associates (USW) representatives are committed to helping customers capitalize on market opportunities and navigate the ever-changing wheat market.

thumbnail

Farmers who spent the past year staring at charts and graphs that gauge costs and returns would certainly by now be quite familiar with the sensation of vertigo.

Up and down, down and up.

The proper term is “volatility,” and for those who make a living growing wheat and other crops, it can affect decisions made in spring – a time when farmers typically spend a lot of money on the front end of one crop while also waiting for the rear end on another.

As they arrive at that sensitive juncture in 2023, growers are finding a “mixed bag” compared to 2022. Analysis have revealed that most farmers are projecting their 2023 production costs to increase 6% to 15% compared to 2022. USDA’s most recent Farm Sector Forecast is slightly more optimistic, but still points to the expectation of higher input costs:

  • Production expenses are forecast to increase for a sixth consecutive year, growing in 2023 by 4.1%.
  • Fertilizers, lime and soil conditioners are expected to decrease 3%, from $43.42 billion to $42.17 billion. Typically, fertilizers represent about 15% of a crop farmer’s costs.
  • Fuels and oils are expected to experience the largest percent decline – 17% – from 2022.
  • These drops, however, are easily outpaced by increases in other expense categories including marketing, storage and transportation, which are forecast to increase 11%.

“Input costs are still quite elevated, but nitrogen fertilizer has decreased since its peak last year,” confirmed Jason Scott, a U.S. Wheat Associates (USW) Board of Directors member who grows soft red winter (SRW) wheat on the eastern shore of Maryland. “One of the larger issues we have been dealing with so far this year is availability of some specific inputs, as well as some parts for equipment.”

Indeed, national agriculture groups say input costs are once again the top concern among farmers in 2023, though there has been some “wiggling toward the positive” in recent months.

“Higher input costs remain the number one concern, chosen by 34% of producers in March, but concern about input costs has been falling since last summer’s peak when it was chosen by 53% of producers,” James Mintert, the Purdue University/CME Group Ag Economy Barometer principal investigator, noted in the most recent Barometer, which was released April 4. “Although producers still cite high input costs as their top concern in the upcoming year, they are becoming more worried about rising interest rates and the impact those higher rates will have on their operations.

Michael Peters, who farms in central Oklahoma, inspects an emerging hard red winter wheat crop.

USW Vice Chairman Michael Peters, who farms in central Oklahoma, inspects an emerging hard red winter wheat crop a few years ago. As was the case back then, production input costs continue to be a major concern for wheat farmers all across the country. Weather and lack of rain, of course, is another point of worry.

But First, Here’s the Weather . . .

USW Vice Chairman Michael Peters, who grows hard red winter (HRW) wheat in Oklahoma, is the farmer who put the “mixed bag” label on his current inputs situation.

He has bigger problems with moisture, or lack thereof.

His farm being located on the Southern Plains, Peters has an added challenge he and other Oklahomans share with fellow producers in northern Texas, most of western Kansas and portions of Nebraska and Colorado.

“The problem for my area is the lack of rainfall,” he said. “Our winter wheat crop is looking a little tough at this point.”

According to USDA, approximately 51% of U.S. winter wheat is produced in an area currently experiencing drought, down from 69% as the year began.

For Oklahoma, in mid-March the USDA rated 34% of the winter wheat crop in “good-to-excellent” condition. For Texas, 18% of the crop was “good-to-excellent.” Roughly 22% of Nebraska’s winter wheat crop was “good-to-excellent.”

Equipment Inputs Rise

While fertilizer and chemical prices have mostly decreased heading into the 2023 spring planting season, sticker shock on parts and machinery have stepped in to replace them as causes for consternation.

“The prices for parts to fix our equipment have really spiked, as have prices for equipment that we would need to purchase new,” said Scott. “The supply chain has still not caught up on some key things.”

Part of the problem being recognized this spring is that there is a transition of sorts in the farming equipment arena. Fixing a broken-down combine or tractor used to take wrenches and a steady hand. Now repairs might require a mobile-device interface, online diagnostic tools and secure software updates. Those “parts” aren’t just hanging on someone’s wall.

As a result, breakdowns that might have been repaired in hours can now take days or weeks. During busy times such as spring planting and harvest, that can mean losing time and money.

“You really think about what you need to get you through the season and what you can do without,” said Peters. “There’s a lot of deferred maintenance on farms right now. When you see elevator prices seep down, you erase projects off your list. If prices start to spike, you add things to the list.”

Jason Scott, who grows soft red winter wheat in Maryland, stands in one of his fields during a spring tour of his farm.

Jason Scott, a member of the USW Board of Directors who grows soft red winter wheat in Maryland, stands in one of his wheat fields during a spring tour of his farm.

Chemicals Leveling Off

“It’s this and that, up and down,” said Peters. “Some fertilizer prices have fallen. Chemicals are mixed, with prices on products like Roundup falling substantially. Other chemicals seem steady.”

Farmers Business Network (FBN) recently released its 2023 Ag Chemical Price Transparency Report, which highlights the extreme price variation facing farmers from coast to coast.

“The last two years have seen extreme fluctuations in chemical pricing for farmers,” said Kevin McNew, chief economist for FBN. “We know, this season in particular, a lot of farmers have postponed or waited a little longer than normal to make purchases because prices have been declining. We’re close to the point of needing those pre-emergents and I don’t think prices are going to slide much more.”

McNew also acknowledges higher interest rates make some farmers hesitant to borrow against an operating loan for chemical purchases.

“The takeaway is a lot of the inputs we’ve come to rely on like fertilizer, ag chem, and energy are going to remain high priced for the foreseeable future,” he said. “For years to come, in some sense. It is really important for farmers to think strategically about investing in new technologies that improve or reduce those inputs.”

The Bottom Line

Enduring volatility is what farmers do, so those preparing to harvest winter wheat and those getting ready to plant spring wheat will adjust to conditions.

It won’t be long until fall arrives and the process repeats itself.

As far as profits, every farm is different. USDA expects inflation-adjusted net farm income to drop 18%. But it notes last year’s net farm income was well above the 20-year average.

The decline will be felt a little differently in each sector of agriculture, said Seth Meyer, the USDA’s chief economist, who spoke at the 2023 Agricultural Outlook Forum in Arlington, Virginia.

Wheat acreage is expected to be its largest since the 2016-17 season, thanks to high prices and tight supply.

“After a period of trending lower (U.S.) wheat acres, this represents a sharp rebound, but is not likely to be a trend reversal for the long term,” Meyer said.

As always the biggest question about 2023 is grain prices, especially wheat prices, which are expected to remain strong, though lower than in 2022.

From a wheat farmer’s perspective, Peters summed it up in a simple manner.

“No matter who you listen to, everything is up and down, up and down,” he said.

thumbnail

Each year, on March 31, those who grow, trade or import U.S. agricultural commodities look to USDA’s annual Prospective Plantings and Quarterly Grain Stocks Report for indications of potential price movements. The consensus from analysts across the industry on how this week’s reports will affect wheat markets is generally bullish.

For reference, in its January 2023 Wheat Outlook report, USDA estimated total U.S. winter wheat planted area for 2023/24 at 37.0 million acres (14.9 million hectares), up 11% from last year to the highest level since 2015/16. The hard red winter wheat (HRW) area was up 10% to 25.3 M/ac (10.2 M/ha), while white winter wheat is up by 3% to 3.73 M/ac (1.5 M/ha). soft red winter wheat (SRW) experienced the most significant increase, jumping 20% from 2022/23 to 7.9 M/ac (3.2 M/ha). USDA’s February Grains and Oilseed Outlook projected an 8% increase in all wheat planted area to 49.5 M/ac (20.0 M/ha)

U.S. Wheat Associates (USW) compiled the following pre-report perspectives.

Analysts See Lower Planted Area

Bloomberg recently surveyed more than 30 agricultural analysts about their prospective plantings estimates for wheat, corn, soybeans and other crops. The average estimate for the total wheat area came in slightly below USDA’s January estimate at 48.9 M/ac. The average winter wheat estimate was 36.3 M/ac, also less than USDA’s 37.0 M/ac. Spring and durum wheat average among the analysts Bloomberg surveyed was 10.9 M/ac for HRS and 1.7 M/ac for durum.

Back in January, agricultural consulting firm Farmers Business Network surveyed U.S. winter wheat farmer members of the organization about their planting intentions. The results showed planted area increases for HRW and SRW, with all U.S. winter wheat planted area seen at 34.2 M/ac for 2023/24, up 900,000 ac compared to their 2022 survey. That is significantly lower than USDA’s 37.0 M/ac January estimate.

Balance Sheet Tightening?

USDA data in a pie chart showing the range of wheat crop conditions in Kansas.

Kansas wheat crop conditions in late March reflects the impact of on-going drought in the western and central areas of the state.

While both Bloomberg’s and FBN’s surveys estimate of winter wheat planted area are up compared to the 2022/23 estimates, FBN Senior commodity Analyst Rejeana Gvillo said U.S. planted is “not large enough to shift the undertone of shrinking global wheat supplies. Given the acreage outlook, the drought in the Southern Plains will need to be broken come spring or summer or the U.S. wheat balance sheet could tighten further.”

Sadly, the drought has not broken in southwest Kansas, southeast Colorado, the northern Texas Panhandle, and the western Oklahoma Panhandle. There has been some easing of drought outside that hard-hit area. Justin Gilpin, CEO of Kansas Wheat does not anticipate major adjustments to USDA’s winter wheat planted area, but he is looking to other farmer decisions ahead.

“Last year, USDA began inching Kansas winter wheat acreage lower in the March report. I expect any changes or adjustments this year to be in the other direction, with slightly higher planted winter wheat acres in Kansas,” Gilpin said, which includes SRW in eastern Kansas. “But any incremental changes at this point are overshadowed by what the harvested acres might be with expected higher abandonment due to the drought conditions and poor stands in southwest Kansas.”

Spring Wheat Planting Delay?

Drought is not the problem in the Northern Plains HRS and durum region. This has been a very wet and cold winter with persistent snow cover.

“Everybody’s pretty much thinking it is going to be a late start” to planting, said Randy Martinson of Martinson Ag Risk Management in a story posted by AgWeek, Fargo, N.D.

On the Agweek Market Wrap, March 24, Martinson said with two feet of snow or more in places in the region and a forecast for little warm up in sight, some farmers already are considering looking for earlier maturing varieties and “questioning whether they should still plan to plant spring wheat.”

Asked about the Prospective Plantings report on March 31, Martinson added that the consensus among farmers he has talked to is there will be more corn and soybeans planted and less spring wheat, though more winter wheat already has been planted. However, he said there likely will be changes depending on how the spring shapes up.

Map of the United States from the USDA Forest Service shows significant snow cover in late March 2023 in the northern plains.

Snow cover in late March is still 10 inches to almost 30 inches deep in parts of U.S. HRS growing regions of South Dakota, North Dakota and Montana. Delayed planting may shift some spring wheat area to other crops this year. Source: USDA Forest Service.

Buy Signals for Speculators

Commercial traders and futures speculators are getting the same information. Barchart analyst Sean Lusk wrote this week that the market is net short in Chicago SRW wheat futures as the plantings and stocks reports are coming on the same day as the month and quarter end. He expected managed money to take profits by buying wheat into the weekend.

In the end, USW believes Martinson is correct in saying the weather and the planting report will be the market movers this week.

thumbnail

Instead of asking “what’s in store” for crackers and cookies and other wheat-based snack foods in a post-COVID world, those in the U.S. wheat industry may want to ask the same question in a slightly modified way.

What’s in the store?

When COVID hit in 2020, international consumers had already been drawn to convenient foods that fit snacking lifestyles. Boxes of crackers were tucked into office drawers. Sleeves of cookies – often referred to as “biscuits” in some foreign markets – were slid into backpacks. While work routines and travel screeched to a halt, snacking habits sped forward. In fact, market research over the past year has indicated that, in many countries, on-the-go snacking is now preferred over traditional sit-down meals, especially by younger consumers.

This movement was aptly labeled “Snackification.” It’s changing the look of grocery and supermarket shelves around the world.

It’s also creating potential opportunities for U.S. wheat.

A 2022 survey by Euromonitor International revealed growing numbers of global consumers who look for snacks when shopping for food.

A 2022 survey by Euromonitor International revealed growing numbers of global consumers who look for snacks when shopping for food.

Snack ‘Em if You Got ‘Em

A Euromonitor survey conducted in 2022 showed South Asia as having the most robust snacking habits. About 45% of Vietnamese consumers surveyed indicated that when shopping for food, they “look for snacks that are convenient to take and eat outside the home.” Roughly 38% of consumers in the Philippines responded the same way. The survey revealed that in Latin America, Colombia had the highest number of outside-the-home snackers with 37%. Brazil was close behind at 36%.

As a comparison, and for perspective, fewer than 30% of consumers in the U.S. were focused on snacking while shopping for food.

Those who study global consumer trends expect the new generation of “snackificators” to munch its way into the future.

“Snack brands already had a large portion of the breakfast category – breakfast bars, breakfast cakes and pastries, and so on – but with consumer preferences changing during COVID, snack foods are now intentionally being positioned as meal replacements throughout the entire day,” offered Carl Quash, head of Snacks and Nutrition for Euromonitor International, an independent market research firm based in London.

Quash, who oversees packaged snack research and analysis in more than 100 markets worldwide, presented a webinar titled “Snackification: The Future of Occasions to USDA stakeholders on Jan. 30.

“Snacking is likely to increase as people become busier and more mobile, and as they feel more comfortable in traveling once pandemic fears fade for good,” said Quash. “Add to that the fact many consumers are now replacing meals with snacks – they snack throughout the day instead of sitting down for a meal.”

Market research has shown increased demand for snack foods, as the dining habits of global consumers continue to evolve.

Market research has shown increased demand for snack foods, as the dining habits of global consumers continue to evolve. USW continues to work with millers and bakers around the world to help in the development of new snack food products made with U.S. wheat and the improvement of existing products.

An Opportunity Knocking?

U.S. Wheat Associates (USW) recognized the new shift, even before snackification became a buzzword. USW’s offices around the world have long been involved in helping develop new snack products made with U.S. wheat, while also helping improve and promote existing products in all markets.

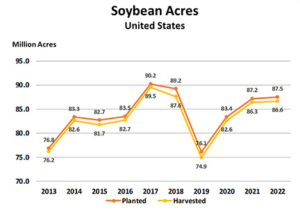
USW promotes the quality advantages of all six U.S. wheat classes. For snack foods, soft red winter (SRW) wheat and soft white (SW) wheat are most commonly used. But hard white (HW) wheat, hard red winter (HRW) wheat and hard red spring (HRS) wheat each are a quality ingredient – ether for snack foods and breads, or as part of flour blends to produce snack foods.

Wheat can also be used in other forms to make snack products. Flaked or puffed wheat is commonly used to manufacture breakfast cereals and cereal snack bars. Wheat bran is added to biscuits, cakes, muffins and breads to increase the dietary fiber content. Wheat germ can be added to breads, pastries and biscuits, or sprinkled onto yogurt, breakfast cereal or fruit dishes to increase the B-Vitamin, protein and fiber content.

USW also provides millers and bakers around the world technical support, including assistance in applying Solvent Retention Capacity (SRC) analysis to better predict performance characteristics of flour for cookies, crackers and cakes.

USW Bakery Consultant Roy Chung says consumers in Asia are more and more interested in quick, "on the go" foods - crackers, cookies and even sometimes as simple as a slice of bread with various toppings.

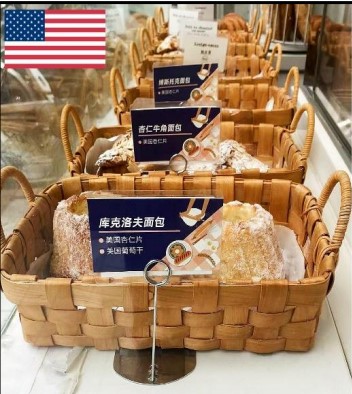
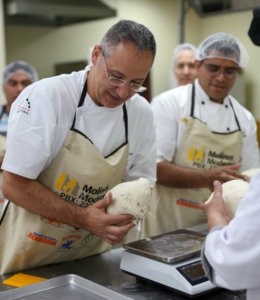
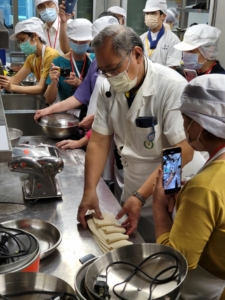
USW Bakery Consultant Roy Chung says consumers in Asia are more and more interested in “on the go” foods – crackers, cookies and even something as simple as a slice of bread with toppings.

A ‘Wheat Team’ Effort, Here and Abroad

“Snackification is definitely a thing in the Philippines, with bread being primarily used for snack foods,” said Joe Bippert, USW Associate Regional Director in South Asia. “All across the region, there are many, many products that have fallen into the snack category, some traditional like crackers and cookies, and some new. We are working with buyers, millers and bakers to make sure U.S. wheat is part of this snackification movement. We also continue to work with our partners to develop new products with U.S. wheat.”

One of those partners is the Wheat Marketing Center (WMC). Based in Portland, Oregon, the WMC regularly conducts research projects on snack food-related topics and wheat flour formulations. USW offices around the world connect snack food makers to the WMC, which works to develop new products to meet changing consumer demands for attributes such as lower sugar or salt, new flavors or even different shapes of crackers, cookies, cakes, breads and other snacks.

A Universal Phenomenon

No one seems to know who created the term “snackification,” but it began appearing in trade journals and food blogs a decade ago. As it did then, today it is used to describe a trend in which consumers snack in place of meals.

A Harris Poll survey commissioned by Mondelēz International last year polled consumers in 12 countries. It found that more than 55% of consumers “nibbled frequently throughout the day” in place of three standard meals, while 71% said they snacked at least twice each day.

Mondelēz International’s fourth annual “State of Snacking” report that “snacking increasingly replaces traditional meals in consumers’ lives.”

“Our State of Snacking report confirms that in these trying times, consumers around the world view their favorite snacks as affordable and necessary indulgences,” Dirk Van de Put, Chairman and CEO of Mondelēz International, noted in the report. “Snacking continues to be a way for consumers to connect or to enjoy a moment of delight in their day, further demonstrating our belief that every snack can be enjoyed in a mindful way.”

Looking back, it is clear urbanization drove snackification, Quash explained.

“Convenience and portability were key due to time pressures and a culture where people were constantly under constraints and were looking for foods to eat while on the go, foods they could eat on their way to the office or in the office while working,” he said. “Although people are still spending more time at home than they did pre-pandemic, snacking has become part of the routine.”

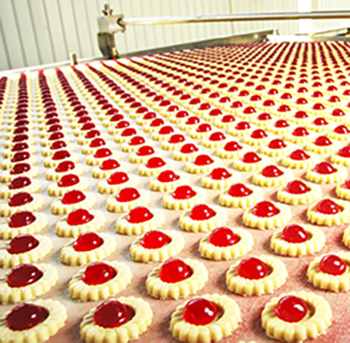
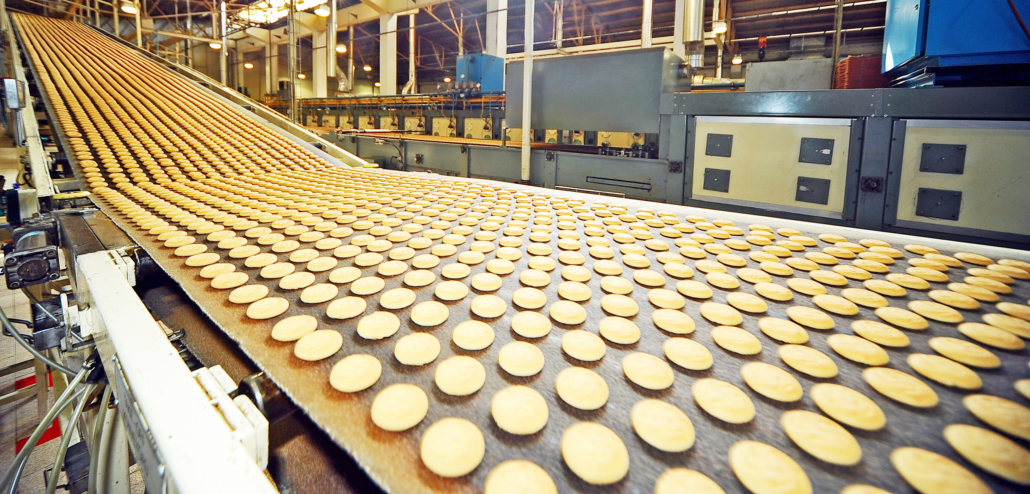
Crackers, Cookies, Biscuits . . . and Bread, Too

In some cases, foods just changed roles. One key consumer trend for U.S. wheat is the fact that breads that were once a big part of traditional sit-down meals are in some countries being used to anchor snack time.

Roy Chung, USW Bakery Consultant based in Singapore, said consumers in Asian countries are walking into retail stores looking for “simple and fast.” In many cases, how the foods are packaged is the biggest factor.

“When it comes to wheat, products range from simple slices of bread made into different types of sandwiches, or just plain bread spread with margarine and topped with sugar, then packaged to eat on the move,” Chung explained. “There are buns with different kinds of fillings, including steam-type buns. These are considered a snack that can fill you up without having to pause to prepare a meal. Grab it and go, as they say.”

Microwave-ready cakes and muffins, prepared in a paper cup and baked at the store, are common.

“In the cracker category, there is canned tuna or salmon or sardines packaged with a stack of crackers, which are popular for people taking a day trip or a bus ride somewhere and are eaten in place of lunch or even dinner,” said Chung. “All of these products are a showcase for the quality of U.S. wheat.”

Consumers shopping their local food store for snacks have other demands, too.

“The snacking trend remains based on convenience, but consumers around the world have become more focused on three things: mobility, value and health,” said Quash. “For the wheat industry, those are generally good things because wheat products tend to deliver on all three.”

By Ralph Loos, USW Director of Communications


thumbnail

By Matthew Weaver, Copyright © Capital Press, February 8, 2023, Excerpts Reprinted with Permission

Wheat prices “probably won’t be quite as good [for farmers]” in 2023 as they were last year, a top grain economist says.

“We won’t see last year’s prices, we’ll be several dollars short of that,” said Randy Fortenbery, the Thomas B. Mick Endowed Chair in Small Grain Economics at Washington State University, told farmers during the Spokane Ag Show. “We can’t be thinking we’re going to see 2022 wheat prices … unless there’s some other shock that’s not being anticipated.”

Soft white wheat ranged from $8.45 to $8.55 per bushel on the Portland market as of Feb. 8. Fortenbery advised farmers to be careful about assuming they’ll see prices above $10 a bushel. He expects wheat prices to trade within a $3 to $3.50 a bushel range. About $9.25 to $10 per bushel would be the high end, he said. [Editor’s Note: USDA lowered its February forecast of average farm gate wheat prices in 2023 to $9.00 per bushel.]

A Different of Opinion

The International Grains Council and USDA have conflicting forecasts for global wheat trade, Fortenbery said.

The council expects total world ending wheat stocks to be up 3% compared to last year and a 1.3% reduction in world wheat trade, which suggests a decline in prices. USDA projects world wheat stocks to be down 2.6% and trade to be up 5%, which suggests a price increase. Fortenbery said he leans toward the international council’s projections.

Both agencies agree the combination of Russia and Ukraine wheat exports will be up compared to last year. The flow of grain out of the Black Sea market appears to have stabilized the price impact of the conflict, Fortenbery said.

SW, SRW Back at Parity

The relationship between Portland white wheat prices and Chicago [soft red winter] wheat futures prices is returning to normal, after white wheat reached a peak of $3 above Chicago futures prices in recent years. The norm for Portland is closer to $1 above Chicago.

Because of the extreme difference, soft white prices didn’t respond last year when Russia invaded Ukraine, while Chicago [soft red winter] wheat prices “exploded,” rising to meet the higher white wheat prices, Fortenbery said. The relative prices are back in synch with each other, he said.

Line chart of USDA and U.S. Wheat Associates data showing wheat prices for soft white and soft red winter exports have converged to near parity in 2022/23.

U.S. soft white and SRW export prices have converged in 2022/23 to near-parity. Source: U.S. Wheat Associates (USW) Price Report – February 3, 2023.

“If the Black Sea ends up being a problem again this spring, we’ll get some bump out of that,” he said.

The market doesn’t currently expect that, but risk remains, Fortenbery said.

Commodity prices generally look favorable in the next few months, but input costs are also at historic highs, Fortenbery said. Almost every major expense category was significantly higher last year compared to 2021; some were up to 60% or more.

He’ll be watching general inflation, which affects interest rates and production loans, and natural gas and refined fertilizer shipments from the Black Sea.

For additional information on U.S. wheat export price trends, see this Wheat Letter post from January 30, 2023: Wheat Prices Trend Lower Even As Uncertainty Continues.

thumbnail

As U.S. Wheat Associates (USW) President Vince Peterson often says, at any given hour of the day someone, somewhere, is talking about the quality, reliability and value of U.S. wheat. Wheat Letter wants to share just some of the ways USW has been working recently to build a preference for U.S. wheat in an ever more complex world wheat market.

Lauding Nutritious, Delicious U.S. Baking Ingredients in China

USW Beijing participated in the USDA Foreign Agricultural Service (FAS) “Discover U.S. Baking Ingredients and Trends” hybrid virtual promotion in August 2022 (activity banner in the photo above). The purpose of this activity was to raise Chinese bakers’ awareness of the nutrition, health benefits, taste, and versatility of U.S. baking ingredients. The FAS Agricultural Trade Office (ATO) in Beijing and 10 USDA Cooperators with products ranging from wheat, dried fruit and nuts to dairy sponsored the activity partnering with the China Association of Bakery and Confectionery Industry.

USW Beijing staff with ATO Beijing at a U.S. Baking Ingredients event.

In-store promotion product 2 using U.S. dried blueberry and California almond slices and U.S. wheat flour

In-store promotion products using U.S. dried blueberry and California almond slices and U.S. wheat flour.

ATO Beijing reported the activity reached an audience of over 2.5 million netizens in China through social media platforms and

over 200,000 real-time viewers through livestreaming. There was also in-store promotions at leading bakery houses in Beijing where “consumers warmly welcomed the new products featuring U.S. baking ingredients,” ATO Beijing reported. Additionally, ATO Beijing strengthened connections with baking associations and businesses and generated trade leads with this activity. Read more here.

USW Beijing Technical Specialist Ting Liu and Marketing Specialist Kaiwen Wu played direct roles representing the essential quality of flour from U.S. wheat in the events. In the three full marketing years since the trade war ended, China has imported a total of more than 168 million bushels (4.58 million metric tons) of U.S. hard red winter (HRW), hard red spring (HRS), soft white (SW) and soft red winter (SRW) wheat, and have already imported almost 23 million bushels of U.S. wheat in the current marketing year that ends May 31, 2023.

Helping a Mexican Baker Expand Sales

In a technical support activity demonstrating to Mexican bakers how to extend their product lines using U.S. wheat flour, USW Mexico City enlisted Baking

U.S. Wheat consultant Didier Rosada

Didier Rosada

Consultant Didier Rosada to conduct an in-depth, multi-day workshop for one of the top three baking groups in Mexico. The commercial baker selected their best 25 master bakers to learn how to produce internationally recognized sourdough, functional breads, and savory breads for retail bakery sales. Rosada also demonstrated how to standardize pre-fermentation and natural sourdough processes to optimize production efficiency, products consistency, and quality in every store.

Baking is changing in a good way,” Rosada said. “At my bakery, my process is as natural as possible, with long fermentation time, like it used to be done, to bring back the flavor profile of a good bread, its shelf life and texture, etc. And U.S. wheat classes are perfect for that. I am using a flour that is almost 100 percent hard red winter or sometimes combined with hard red spring wheat.”

Mexico is the leading importer of U.S. wheat in the world.

Healthier Wheat Foods for Older Taiwanese Consumers

Chinese wheat foods seminar

Well-known Taiwanese chefs demonstrated healthy Chinese wheat food products .

USW Taipei collaborated with the Department of Food and Beverage Management of Shih Chien University (USC) to conduct workshops on Chinese Wheat Food for the Elderly in October 2022. Chinese wheat foods are popular but a survey by the university indicated that more than 60% of elderly Taiwanese are not satisfied with the healthiness of the products.

USW Taipei Country Director Boyuan Chen and Technologist Wei-lin Chou invited well-known Taiwanese chefs to teach methods for making healthy handmade noodles, pan-fried stuffed buns, silk thread rolls, and pan-fried sweet potato pastry as well as steamed breads using U.S. wheat white flour and whole wheat flour. The 40 participants included teachers, students, and long-term elderly care community volunteers who made pan-fried stuffed buns for the elderly just after the workshop.

U.S. wheat imports by Taiwan have averaged 43.2 million bushels (1.18 million metric tons) of HRS, HRW and SW per year since 2017/18.

Continuing Milling Education Interrupted by COVID in Korea

USW Seoul had started to educate Food Technology undergraduate students at Won Kwang University about the fundamentals of U.S. wheat and flour milling technology in 2018. USW Seoul Food/Bakery Technologist Shin Hak (David) Oh resumed that effort this year. The goal is to give these future industry professionals a better understanding of why flour products from U.S. wheat make superior quality ingredients for Korean wheat foods. The early exposure to U.S. wheat and the value-added technical support from USW also builds future productive relationships.

On average the past five marketing years, South Korean millers have imported about 56.7 million bushels (1.54 million metric tons) of U.S. HRW, HRS, SW and SRW wheat per year.

USW Baking Technogist Shin Hak Oh lecturing to Korean food industry students on U.S. wheat and milling technology

USW Baking Technogist Shin Hak Oh lecturing to Korean food industry students on U.S. wheat and milling technology

U.S. Soft Wheat Best for Cookies, Cakes

USW Cape Town sent six participants from a large South African food company to a specialty soft wheat flour course at the Wheat Marketing Center in Portland, Ore., earlier in 2022. The course focused on cookies, crackers, and cakes made with flour from SRW and SW compared to flour from local and imported hard wheat that is used in South Africa. The participants also visited local grocery stores to gain insight into the many, varied U.S. products made from soft wheat flours.

USW Cape Town Regional Director Chad Weigand accompanied the food industry professionals to the course. He said participants were very impressed with the course results and comparative product quality, and he expected the company to begin testing products made with U.S. soft wheat flour.

Read more here about the South African wheat market.

thumbnail

It is planting season for U.S. winter wheat growers. Conditions and timing vary by region, but a lot of the 2023 hard red winter (HRW), soft red winter (SRW) and even fall-seeded soft white (SW) area has already been seeded.

Long before farmers select and clean seed from their last crop or purchase certified seed wheat, researchers and breeders have developed new wheat varieties that meet the highest standards of yield and quality across a wide range of end uses at home and across the world.

Chart showing seasonal U.S. winter wheat and spring wheat planting and harvesting schedule.

U.S. Winter Wheat Planting starts in September and can last into early November depending on conditions. Winter wheat must experience a period of significant cold days to signal reproductive growth, a process called vernalization.

In a greenhouse at the Kansas Wheat Innovation Center in Manhattan, Kansas State University wheat breeder Dr. Allen Fritz talked about starting the process of creating wheat varieties.

Looking Back to the Future

“There are facilities like this around the country where people are working to improve varieties for those different regions,” he said. “They are working on specific market classes have different functionalities to be able to make almost any kind of wheat food product.”

Dr. Fritz added that to do that work, breeders are finding new ways to use historic wheat genetics to improve wheat quality and production.

“In some projects, we are reaching back into wild relatives and bringing some of those characteristics to bring healthy, nutritious food to the table and I think [breeders] have a passion to bring that forward.”

Naturally Stronger Gluten

At Oklahoma State University, Wheat Genetics Chair Brett Carver and his colleagues are developing new hard red winter wheat varieties that have better gluten strength to produce higher quality bread products while keeping yields and disease resistance high. With naturally developed dough strength, such new varieties may not need additional gluten, adding value to the U.S. wheat and flour produced from it.

“Simply stated, a truly unique combination of wheat quality in a high-performance wheat variety provides value-capturing opportunities to farmers, millers and bakers,” Dr. Carver recently told the High Plains Journal. “It is important that the genetics are maintained and delivered throughout the supply chain in its purest form. Then consumers will see value through a cleaner label on various wheat food products.”

Planting Stories

Image from inside a tractor of a dry Montana field in which Denise Conover is seeding winter wheat

This is Denise Conover’s “office” as she seeded hard red winter wheat on her family farm near Broadview, Montana, late in September 2022.

After years of testing and perfecting U.S. winter wheat seeds, planting looks different for every family farm depending on the region, the soil, the wheat class. In the arid conditions in north-central Oregon, for example, each field lies fallow for a year to improve moisture and add organic matter to the soil.

“Then in the fall, at the end of September to the first part of October, we start seeding,” said Logan Padget, a SW wheat grower in Grass Valley, Ore. “We put down our seed and fertilizer together in one pass, one right underneath the other so as soon as that seed starts to grow, it puts roots down, finds the fertilizer and just takes off.”

Near Okarche, Okla., HRW grower and U.S. Wheat Associates (USW) Secretary-Treasurer Michael Peters is seeing very dry conditions for planting. When the time is right, Peters said everything will be done to start the new crop.

Doing What It Takes

“We will start as early as we can in the morning, go late into night,” he said. “Then we may go home at night, and we are loading seed wheat for the next day or adjusting the planter, just to get it into the ground.”

Kyler Millershaski, a young farmer from Lakin, Kan., is fully committed to the work and challenge of growing another hard white and hard red winter wheat crop.

“I would say there is certainly a responsibility and a weight that you feel to not only provide a high-quality product, but enough of it to feed the world. That is why we are really selective in our varieties and make sure the crop has the right fertilizer and nutrients to grow and perform well. That way,” he said with a smile, “we can say we have the best wheat in the world – so buy from us.”


thumbnail

A dramatic increase in demand for oilseeds could impact U.S. wheat production in coming years, with significantly more acres expected to be planted in soybeans destined for new and expanded crushing facilities.

Between 20 million and 25 million additional acres of soybeans will be needed to meet requirements of the renewable diesel industry, some analysts are predicting.

At the same time, global demand for wheat is also expected to rise, setting up dynamic competition for acreage in states where both crops are grown. For the U.S. wheat industry, the situation creates important questions: How much wheat acreage could potentially be lost to soybeans? Will lost acres impact the U.S.’ standing as the world’s most dependable wheat supplier? Can wheat and soybeans co-exist in a competitive environment?

This chart shows acreage planted in soybeans and wheat in 2022 in the country's top 10 soybean states, according to USDA's National Agricultural Statistics Service.

This chart shows total acreage planted in soybeans and total acreage planted in wheat in the country’s top 10 soybean states in 2022, according to USDA’s National Agricultural Statistics Service (NASS).

Where possible, farmers may adapt and double-crop more wheat and soybeans to maintain supplies of both crops. It is already a common practice in top soybean states like Illinois, Indiana and Ohio, where soft red winter wheat is the dominant class. But in soybean states that produce hard red winter and hard red spring wheat – Kansas, Nebraska, South Dakota and North Dakota, for example – allotting acreage is more complicated due to average rainfall and shorter growing seasons.

The ultimate question is if U.S. farmers will be able to meet the demand for both wheat and soybeans by doing what they have always done – figure out a way to do more with less.

Many Options, Limited Acres

Mike Krueger, a grain industry consultant with Lida Communications, put a spotlight on the emerging “competition for acreage” during last month’s U.S. Wheat Associates World Staff Conference.

While describing volatility in global wheat and grain markets due uncertain market conditions, Krueger noted a more predictable factor that will affect markets and decisions made by U.S farmers.

“Renewable diesel is projected to increase eight-fold by 2030 and significant investments of more than $2 billion are being put into new and expanded soybean processing plants in the U.S. right now,” Krueger explained. “The U.S. soybean crush will expand by 10%, or more. We are talking vast numbers, and while sunflower and canola should be big beneficiaries of renewable diesel, soybeans are certainly going to be in even higher demand.”

A boost of 20 million acres would catapult soybean and go a long way toward meeting the projected oilseeds demand.

But at what cost?

The U.S. has consistently ranked as one of the top five wheat producing countries in the world and one of the top three wheat exporting countries. Would a major shift in acreage affect U.S. production, thus its place as a supplier?

“We must remember there’s also a global demand for wheat, as well as corn, and we have to consider ongoing drought and weather patterns, not to mention political conflicts that are impacting grain production and supplies all over the world,” Krueger said. “All of this, all the things going on that affect global trade, will put major emphasis on overall crop production in the U.S. and the entire Northern Hemisphere. To be honest, no crop can afford to give up or lose acres.”

Can Double-cropping Help?

Higher prices caused by global demand for wheat and soybeans appears to be motivating more farmers in the Midwest to consider seeding soft red winter wheat in the fall and soybeans in the same field following wheat harvest.

About 40% of producers responding to a Purdue University Ag Economy Barometer survey in June indicated they have utilized a wheat and soybean double-crop rotation in the past. About 28% of those producers planned to increase the amount of cropland devoted to this rotation by seeding more wheat this fall followed by soybean plantings on the same acres in spring 2023.

Some analysts have predicted that renewable diesel demand in coming years will require the planting of at least 20 million additional acres of soybeans. This chart from USDA shows soybean acreage over the past decade.

Some analysts have predicted that renewable diesel demand in coming years will require the planting of at least 20 million additional acres of soybeans. This chart from USDA shows soybean acreage and harvest over the past decade.

Ultimately, the biggest factor behind whether farmers begin growing an extra crop of wheat is what price they can get for the crop.

“The shift toward increasing soft red winter wheat acreage is likely the result of the expected profitability improvement of the wheat and double-crop soybean rotation,” James Mintert and Michael Langemeier, authors of the Purdue survey, noted.

A move by the federal government earlier this year to increase the number of counties eligible for double-cropping insurance was a move aimed at boosting U.S. production of wheat and soybeans by reducing the risk for farmers who decide to take the double-crop route.

Producers are well-aware that there are drawbacks to double-cropping wheat and soybeans.

“Compared to single-crop soybeans, double-crop soybeans have a shorter growing season due to the delay in planting until the wheat is harvested, which often result in reduced yields,” said Scott Gerlt, Chief Economist for the American Soybean Association (ASA). “Despite this drawback, double-cropping does allow increased production.”

Wheat Demand to Grow

Despite questions about acreage and production, U.S. wheat continues to be in demand by international customers because of its consistent quality and reliability.

Krueger expects the demand will continue to expand.

“A primary reason is that global wheat supplies are likely to shrink due to a renewed focus on soybeans, and to a lesser extent, corn,” Krueger said. “Another factor favoring U.S. producers involves shipping and logistics limitations that hamper competing wheat-growing countries, including Russia and Ukraine.”

Effects from a third consecutive La Nina would further pressure global supplies.

“These things will undoubtedly lead to more export demand for wheat,” Krueger said. “Can the U.S. meet the demand? That is the puzzle that’s still being put together. Farmers make decisions every single planting season. They only have so many acres to work with.”


thumbnail

In 2022, U.S. wheat farmers continued a now three-year run producing excellent quality soft red winter (SRW) wheat for the world’s weak gluten wheat buyers and food processors.

U.S. SRW is grown over a wide area mainly east of the Mississippi River. The production region experienced generally good growing conditions in the 2022 crop year. A total of 230 samples from elevators in 18 reporting areas across 11 states accounting for an estimated 68% of total U.S. SRW production, were collected and analyzed by Great Plains Analytical Laboratory, Kansas City, Mo. The results were weighted by the estimated production for each reporting area and combined into “Composite Average,” “East Coast” and “Gulf Port” values.

Illustration shows states in which soft red winter wheat samples were drawn and the percentage of total SRW the samples represent

Hitting Quality Targets

The 2022 SRW crop is very sound with high test weight and falling number values, lower moisture, good milling characteristics, and is relatively free of DON. Processors will find a versatile crop with good qualities for cookies, cakes and crackers. With higher protein and good extensibility, the crop should also be valuable in blending for baking applications.

Buyers are encouraged to review their quality specifications to ensure that purchases meet their expectations.

U.S. Wheat Associates (USW) has posted more information on the Soft Red Winter Wheat 2022 Quality Survey on its website here.

The Season in Review

Planting started at a normal pace in mid-September 2021 and progress was similar to the 5-year average. USDA estimates SRW seeded area for the 2022 harvest at 2.78 million hectares, up from 2.67 million hectares seeded for the 2021 harvest and above the 5-year average.

As the crop developed, there was plentiful moisture through winter and spring with only Maryland seeing lower soil moisture. Overall, timely mild temperatures and rainfall benefited critical kernel development.

Harvest began slowly in late-May but picked up pace in mid-June with hotter temperatures and dry conditions. By July, much of the growing region experienced heat, humidity and above average rainfall with pockets of favorable harvest weather.

2022 SRW production is estimated to be 10.4 million metric tons (MMT), up from 9.8 MMT in 2021 and above the 5-year average of 8.3 MMT.

Close up image of soft red winter wheat ready for harvest on an Ohio farm

Excellent Crop. Soft red winter wheat was ready for harvest in June 2022 on the Bowsher family farm near Waynesville, Ohio. Across the production region, protein, test weight, kernel characteristics and other functional factors were very good in 2022.

2022 Crop Highlights

  • The overall grade sample average for the 2022 SRW harvest survey is U.S. No. 1 SRW; the Gulf average is U.S. No. 1 SRW, and East Coast is U.S. No. 2.
  • Test Weight averages trended higher and indicate a sound crop with a Composite average of 60.1 lb/bu (79.1 kg/hl), a Gulf average of 60.3 lb/bu (79.3 kg/hl) and East Coast average at 59.7 lb/bu (78.5 kg/hl).
  • 1000 Kernel Weight, Kernel Diameter and Wheat Protein values reflect a relatively consistent crop.
  • Single Kernel values also reflect a consistent crop. For the East Coast, kernels are softer, heavier and larger than last year but harder and smaller than the 5-year average. For the Gulf, kernels are slightly softer, lighter and smaller than last year, but harder than the 5-year average.
  • Wheat Protein content demonstrates a consistent crop. The Composite average of 9.6% (12% mb) and East Coast average of 10.1% are higher than 2021 and 5-year averages. The Gulf average of 9.4% is slightly higher than 2021 but below the 5-year average.
  • Falling Number trended well above average, indicating this is a sound crop with very little sprout damage. Composite (327 sec), East Coast (336 sec) and Gulf (325 sec) are all above 2021 and 5-year averages.
  • Vomitoxin (DON) averages are well below the USDA threshold of 2.0 ppm and indicate that the sampled crop is relatively free of DON: Composite (0.7 ppm), Gulf (0.8 ppm) and East Coast (0.4 ppm).
  • Laboratory Mill Flour Extraction for Composite (66.4%), East Coast (66.6%) and Gulf (66.4%) are all higher than 2021 but below the 5-year averages. The extraction rate from a laboratory mill is not optimized and will always be significantly lower than the rate obtained from a commercial mill.
  • Amylograph data indicates enhanced starch characteristics that are well suited for batter-based products. The 2022 averages for Composite (666 BU), East Coast (574 BU) and Gulf (687 BU) reinforce the high falling numbers and indicate very low levels of amylase activity.
  • Solvent Retention Capacity (SRC) values generally indicate excellent quality for cookies and crackers. Sucrose values indicate cookies and crackers will benefit from reduced baking time.
  • Dough Properties suggest that this crop is weaker than the 5-year average and is typical for SRW.
  • Alveograph data indicate a crop that is more extensible, less resistant than last year and is suitable for blending bread-type products. P values: Composite (36 mm), East Coast (41 mm) and Gulf (35 mm); L values: Composite (82 mm), East Coast (91 mm) and Gulf (80 mm).
  • Average Loaf Volumes are higher than last year and indicate this crop is excellent for blending: Composite (624 cc), East Coast (610 cc) and Gulf (627 cc).
  • The Cookie Spread Ratios for Composite (10.7), East Coast (10.6) and Gulf Ports (10.7) are all similar to last year and higher than the 5-year averages, indicating good spreadability.

The latest 2022 USW Harvest Report on all U.S. wheat classes is posted here. Wheat Letter will share final crop quality reports as they are available, and reports will be posted here.