In the increasingly competitive global wheat market, it is important to review the advantages that U.S. wheat delivers to millers and bakers. This post examines the advantages that soft red winter wheat brings to the market.
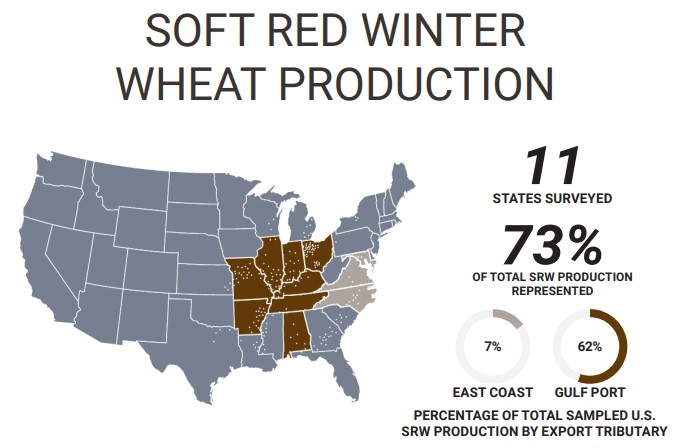
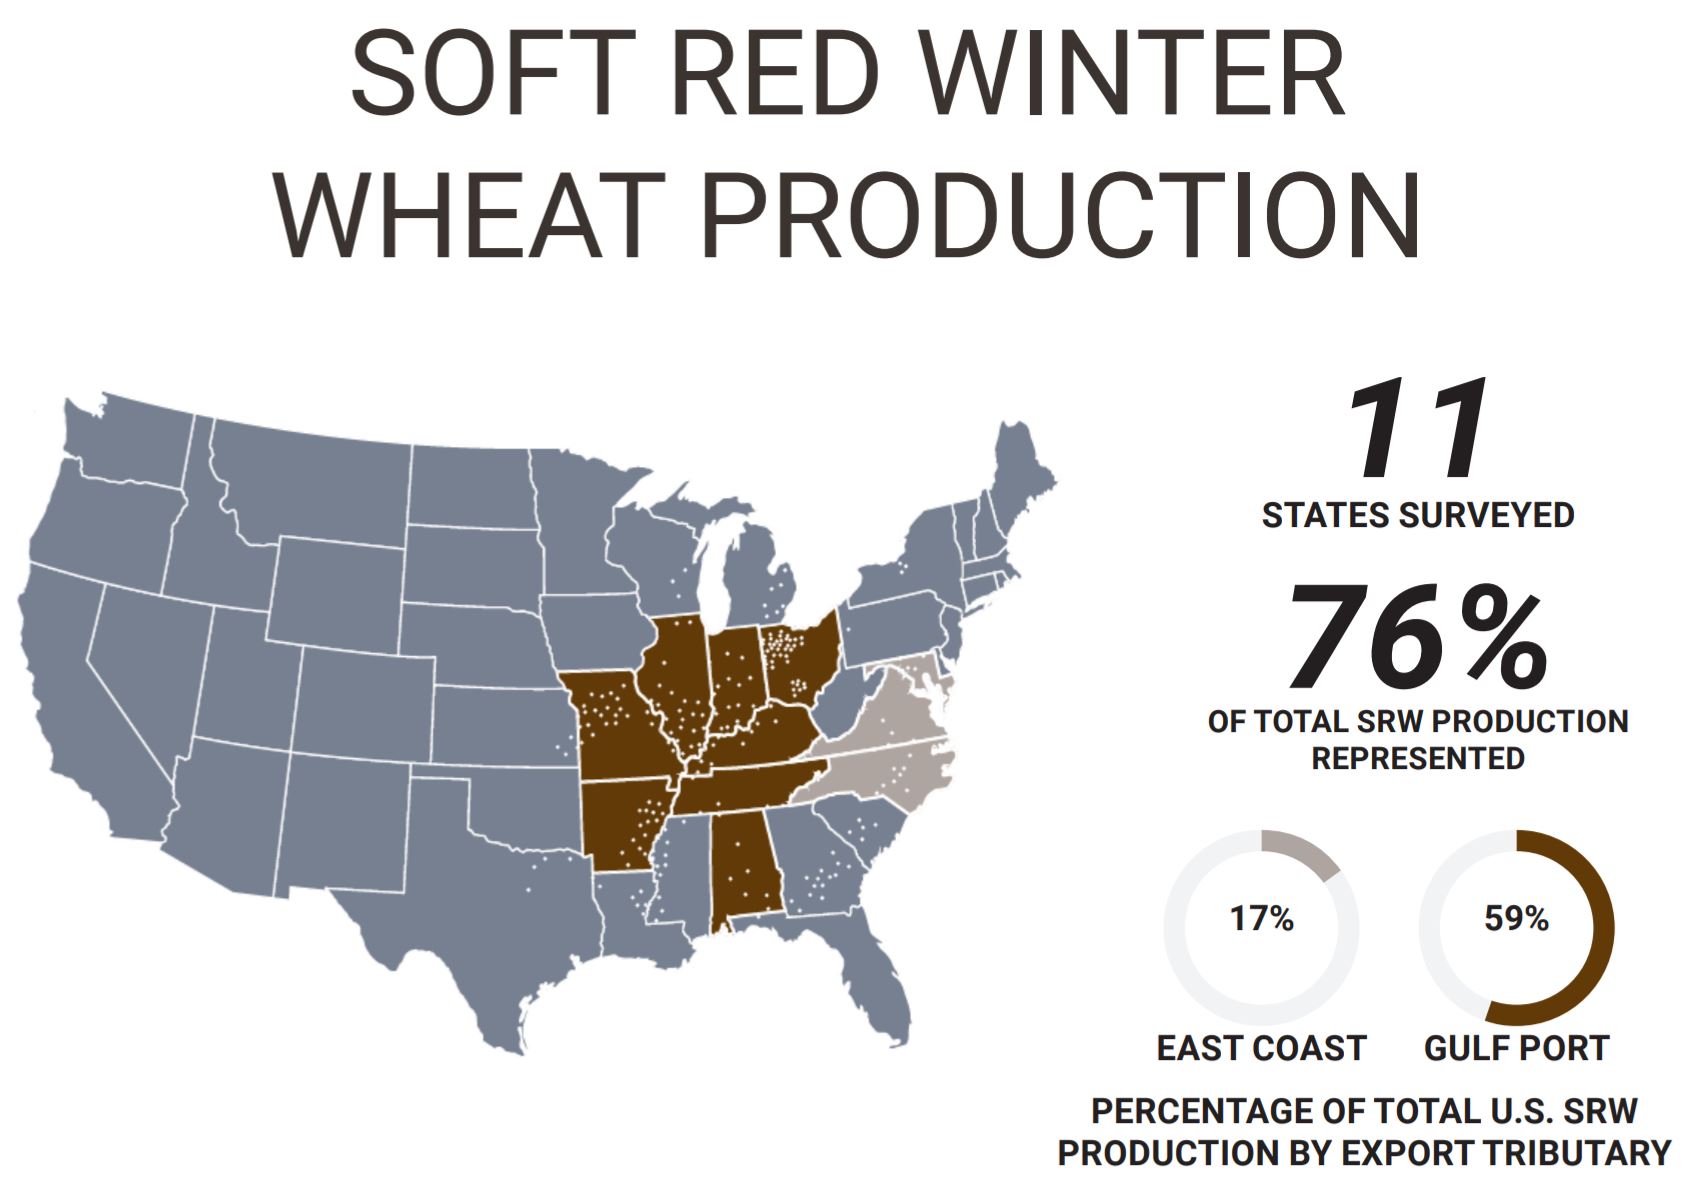
Soft red winter (SRW) wheat is the third-largest class of wheat grown in the United States, with an annual average production over the last five years of 8.28 million metric tons (MMT), or just over 300 million bushels. Although SRW is the third largest class measured by production, it is the fourth largest as measured by export sales. U.S. SRW wheat is predominantly grown east of the Mississippi River and the South as far west as northeast Texas and southeast Kansas.
Importers of SRW are served from ports on the Lakes, East Coast, Gulf, and Western Gulf. Mexico imports a substantial portion of its SRW purchases via direct rail shipment. Importers and the domestic milling and baking industries use SRW for specialty products such as cookies (biscuits), crackers, snack foods, and cake flour. SRW is a versatile wheat for blending with hard red spring (HRS) and hard red winter (HRW) wheat to lower grist cost and improve bread crumb texture, or to improve the quality and appearance of a wide variety of products.
Milling Advantages
SRW can be challenging to mill. Some advantages to milling SRW are reduced energy requirements, and fewer rollermills for mill flows designed specifically for soft wheat. Few mills are designed for only SRW as it is generally a specialty wheat used for specialty products. The real advantage for milling companies is the cost reduction of the mill grist and increased diversity of products when SRW is included in a long-term, strategic wheat procurement plan. SRW performs best on the mill at a lower moisture content (14.5%) compared to hard wheat (16%) and requires increased sifter area per metric ton.
Baking Advantages
The target market for SRW is confectionary products, but it also performs well as a blending flour in a wider variety of products such as crackers and cookies. The lower moisture content of the flour creates an advantage for the baker by increasing the amount of water added while optimizing water absorption and product quality for the consumer. The finer particle size generally increases the water absorption rate, decreasing mix time and improving production efficiencies. As is the message with most U.S. wheat classes, blending SRW flour with other flour types creates opportunities to create the optimal flour type for any number of end-use products. Some markets have found success blending SRW wheat flour with HRS and HRW wheat flour to improve crumb texture and even the loaf volume of pan bread by improving the dough development and mixing properties.
Sourcing Opportunities
Soft red winter wheat is lower in protein than hard wheat classes and is generally lower in cost. It is most often available for export out of the Mississippi River but at times can be shipped via rail to the center Gulf or Mexico. Another critical factor to consider when purchasing SRW is to include a maximum value for deoxynivalenol (DON), particularly in years when SRW matured during wet, humid conditions.
Optimal purchases of SRW are combined with HRW or HRS to minimize storage constraints at the destination mill. There is a high demand for SRW in the domestic U.S. market. In years where acreage and production are lower than average, the price can be inverted in comparison to higher protein classes.
U.S. Wheat Advantages
As we highlight each specific class in this series, let us not forget the advantages that all U.S. wheat classes bring to the market. First, and perhaps the most important, is consistency in quality and supply. Although each new crop year brings different challenges and opportunities, U.S. wheat is always available to the global market. Second, U.S. wheat delivers variety. Wheat is a raw material manufactured into a bakery ingredient: flour. The flour made from each unique class of U.S. wheat brings value to the market through unique quality characteristics that make a variety of baked goods and noodles. Further, blending flours from one or more types of wheat is an important component for customers to understand as part of optimizing flour performance at a minimal cost.
Each region, country and culture have wheat-based food products that are uniquely their own. With six unique wheat classes, the United States has the right wheat class to deliver the optimal quality and value for every variety of product on the market.
Learn more about the six classes of U.S. wheat here or leave a question in our “Ask The Expert” section.
By Mark Fowler, USW Vice President of Global Technical Services
Read more about other U.S. wheat classes in this series.