thumbnail

On behalf of the U.S. Wheat Associates (USW) Transportation Working Group, we* appreciate the opportunity to provide comments on the draft Lower Snake River Dams Benefit Replacement Report.

The draft report raises serious concerns among U.S. Wheat Associates (USW) and its member states. The USW Transportation Working Group (TWG) questions many of the baseline assumptions argued in the draft report. The draft is incomplete because many of the key variables cannot be quantified. The Lower Snake River Dams (LSRD) provide a critical need that moves U.S.-grown wheat to high-value markets around the world. Breaching the dams would have serious economic consequences for producers and grain handlers. Removing the dams also runs counter to achieving climate-friendly goals.

Barging Benefits

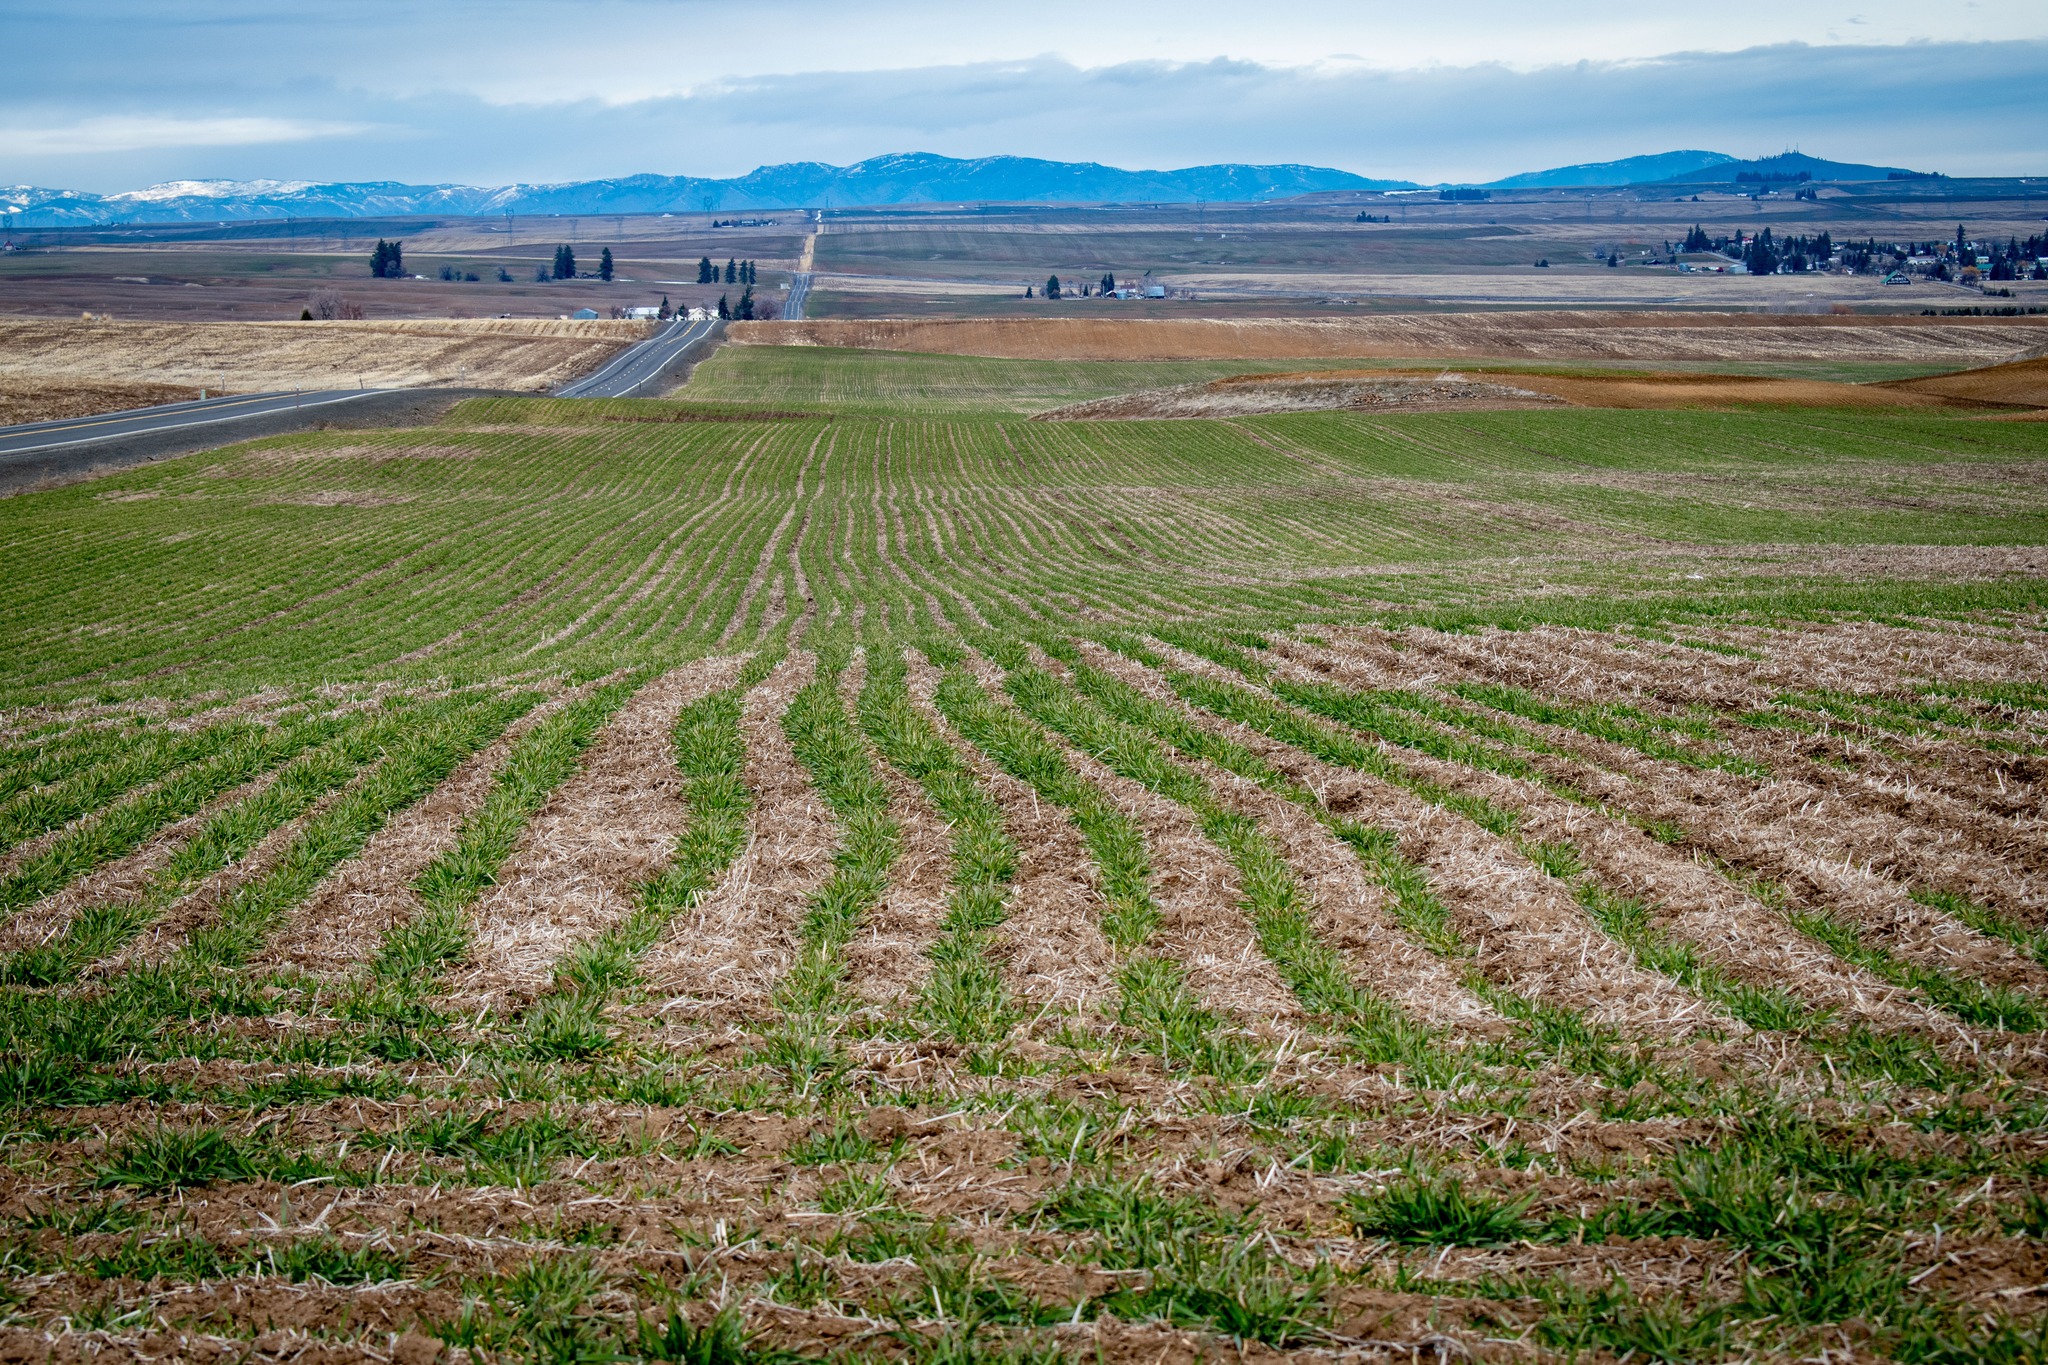
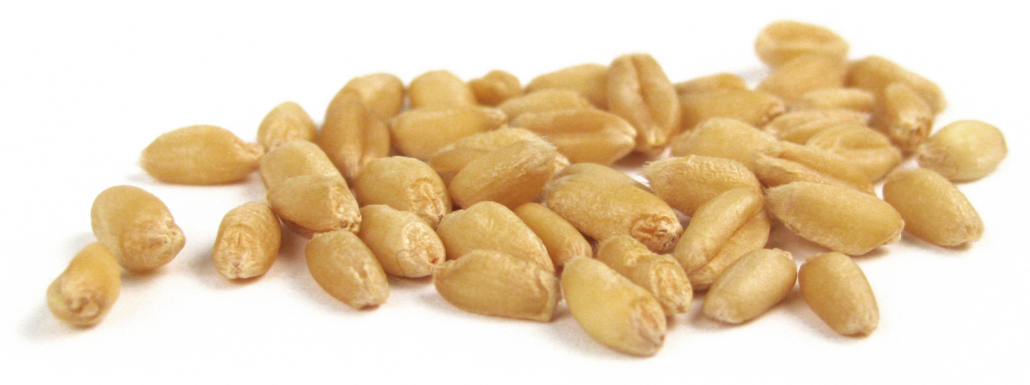
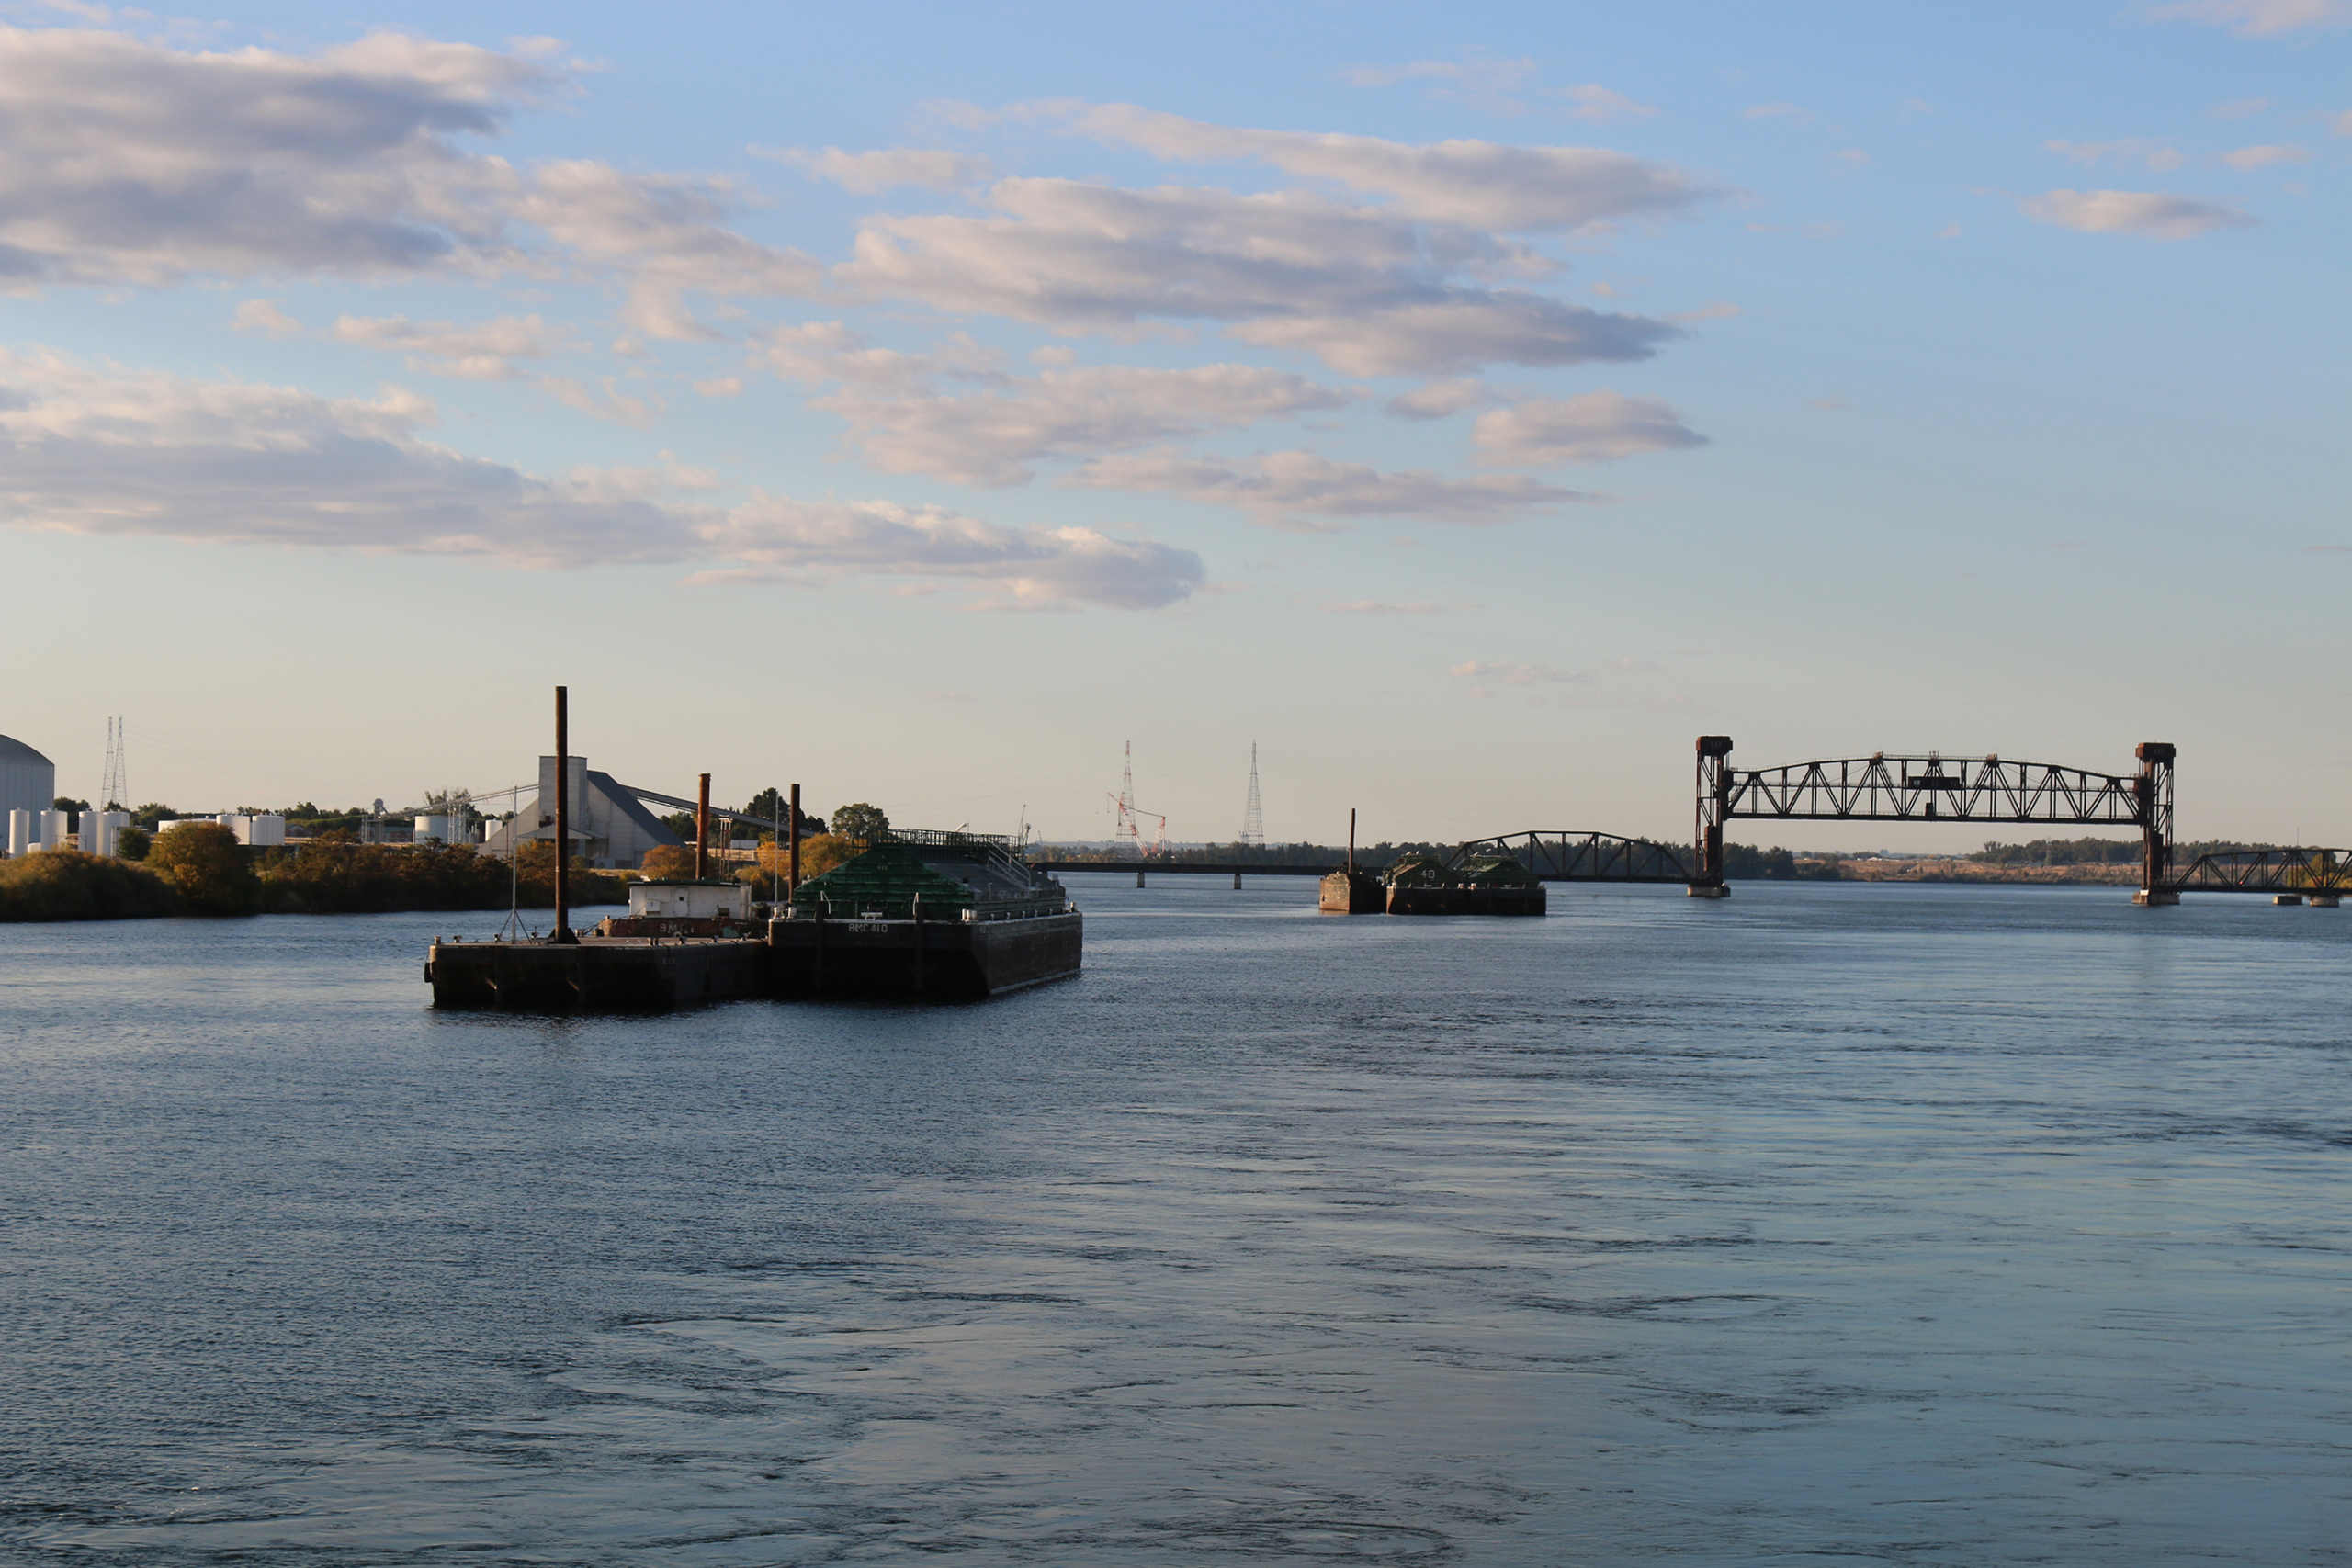
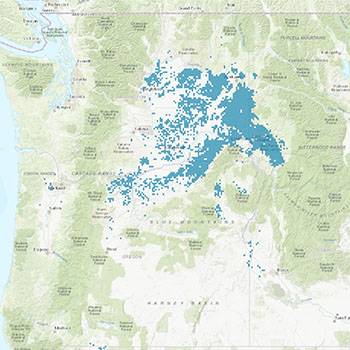
USW strongly supports the sustainability and reliability of wheat transportation by barge. The Columbia Snake River System is an essential part of a logistical web that moves over half of all U.S. wheat exports to more than 20 Pacific Rim countries and encompasses some of the largest U.S. wheat buyers in the world. The Snake River moves more than 10% of all wheat that is exported from the United States. Because of the cost savings conveyed by barging grain and examples used in the draft report, we can conclude that farmers save considerably by using the waterway in place of rail or truck and are able to pass on savings to consumers.

Barge loading wheat to move through Lower Snake River Dams and down the Columbia River to export elevators.

The Lower Snake River Dams provide critical needs for wheat farmers, grain handlers, merchandisers, and millers. The draft report clearly outlines the benefits enjoyed by grain handlers, “barging is the lowest-cost option (per ton-mile) for wheat shipping, an additional benefit for Pacific Northwest producers, as they operate on narrow cost margins and use barging to maximize their profit per bushel.” Shifting the current volume of wheat and other grains moving via barge on the LSRD over to rail or truck is not a viable and straightforward solution as portions of the draft study imply. Rail and truck cost significantly more on a per bushel basis, and trucks have distance limitations.

Breaching Increases Transportation Costs

An excerpt from the draft report outlines the literal costs to farmers: “One of the most significant transportation impacts connected with LSRD breaching is shipping costs. Several studies cite shipping prices during scheduled lock outages for maintenance between December 2010 and March 2011 and found that during the outage, over 90% of the grain by volume was shipped by rail and that shippers experienced a nearly 40% increase in shipping and storage costs.” This example shows that railroads will use their power to raise rates when other alternatives, like the river system, are unavailable.

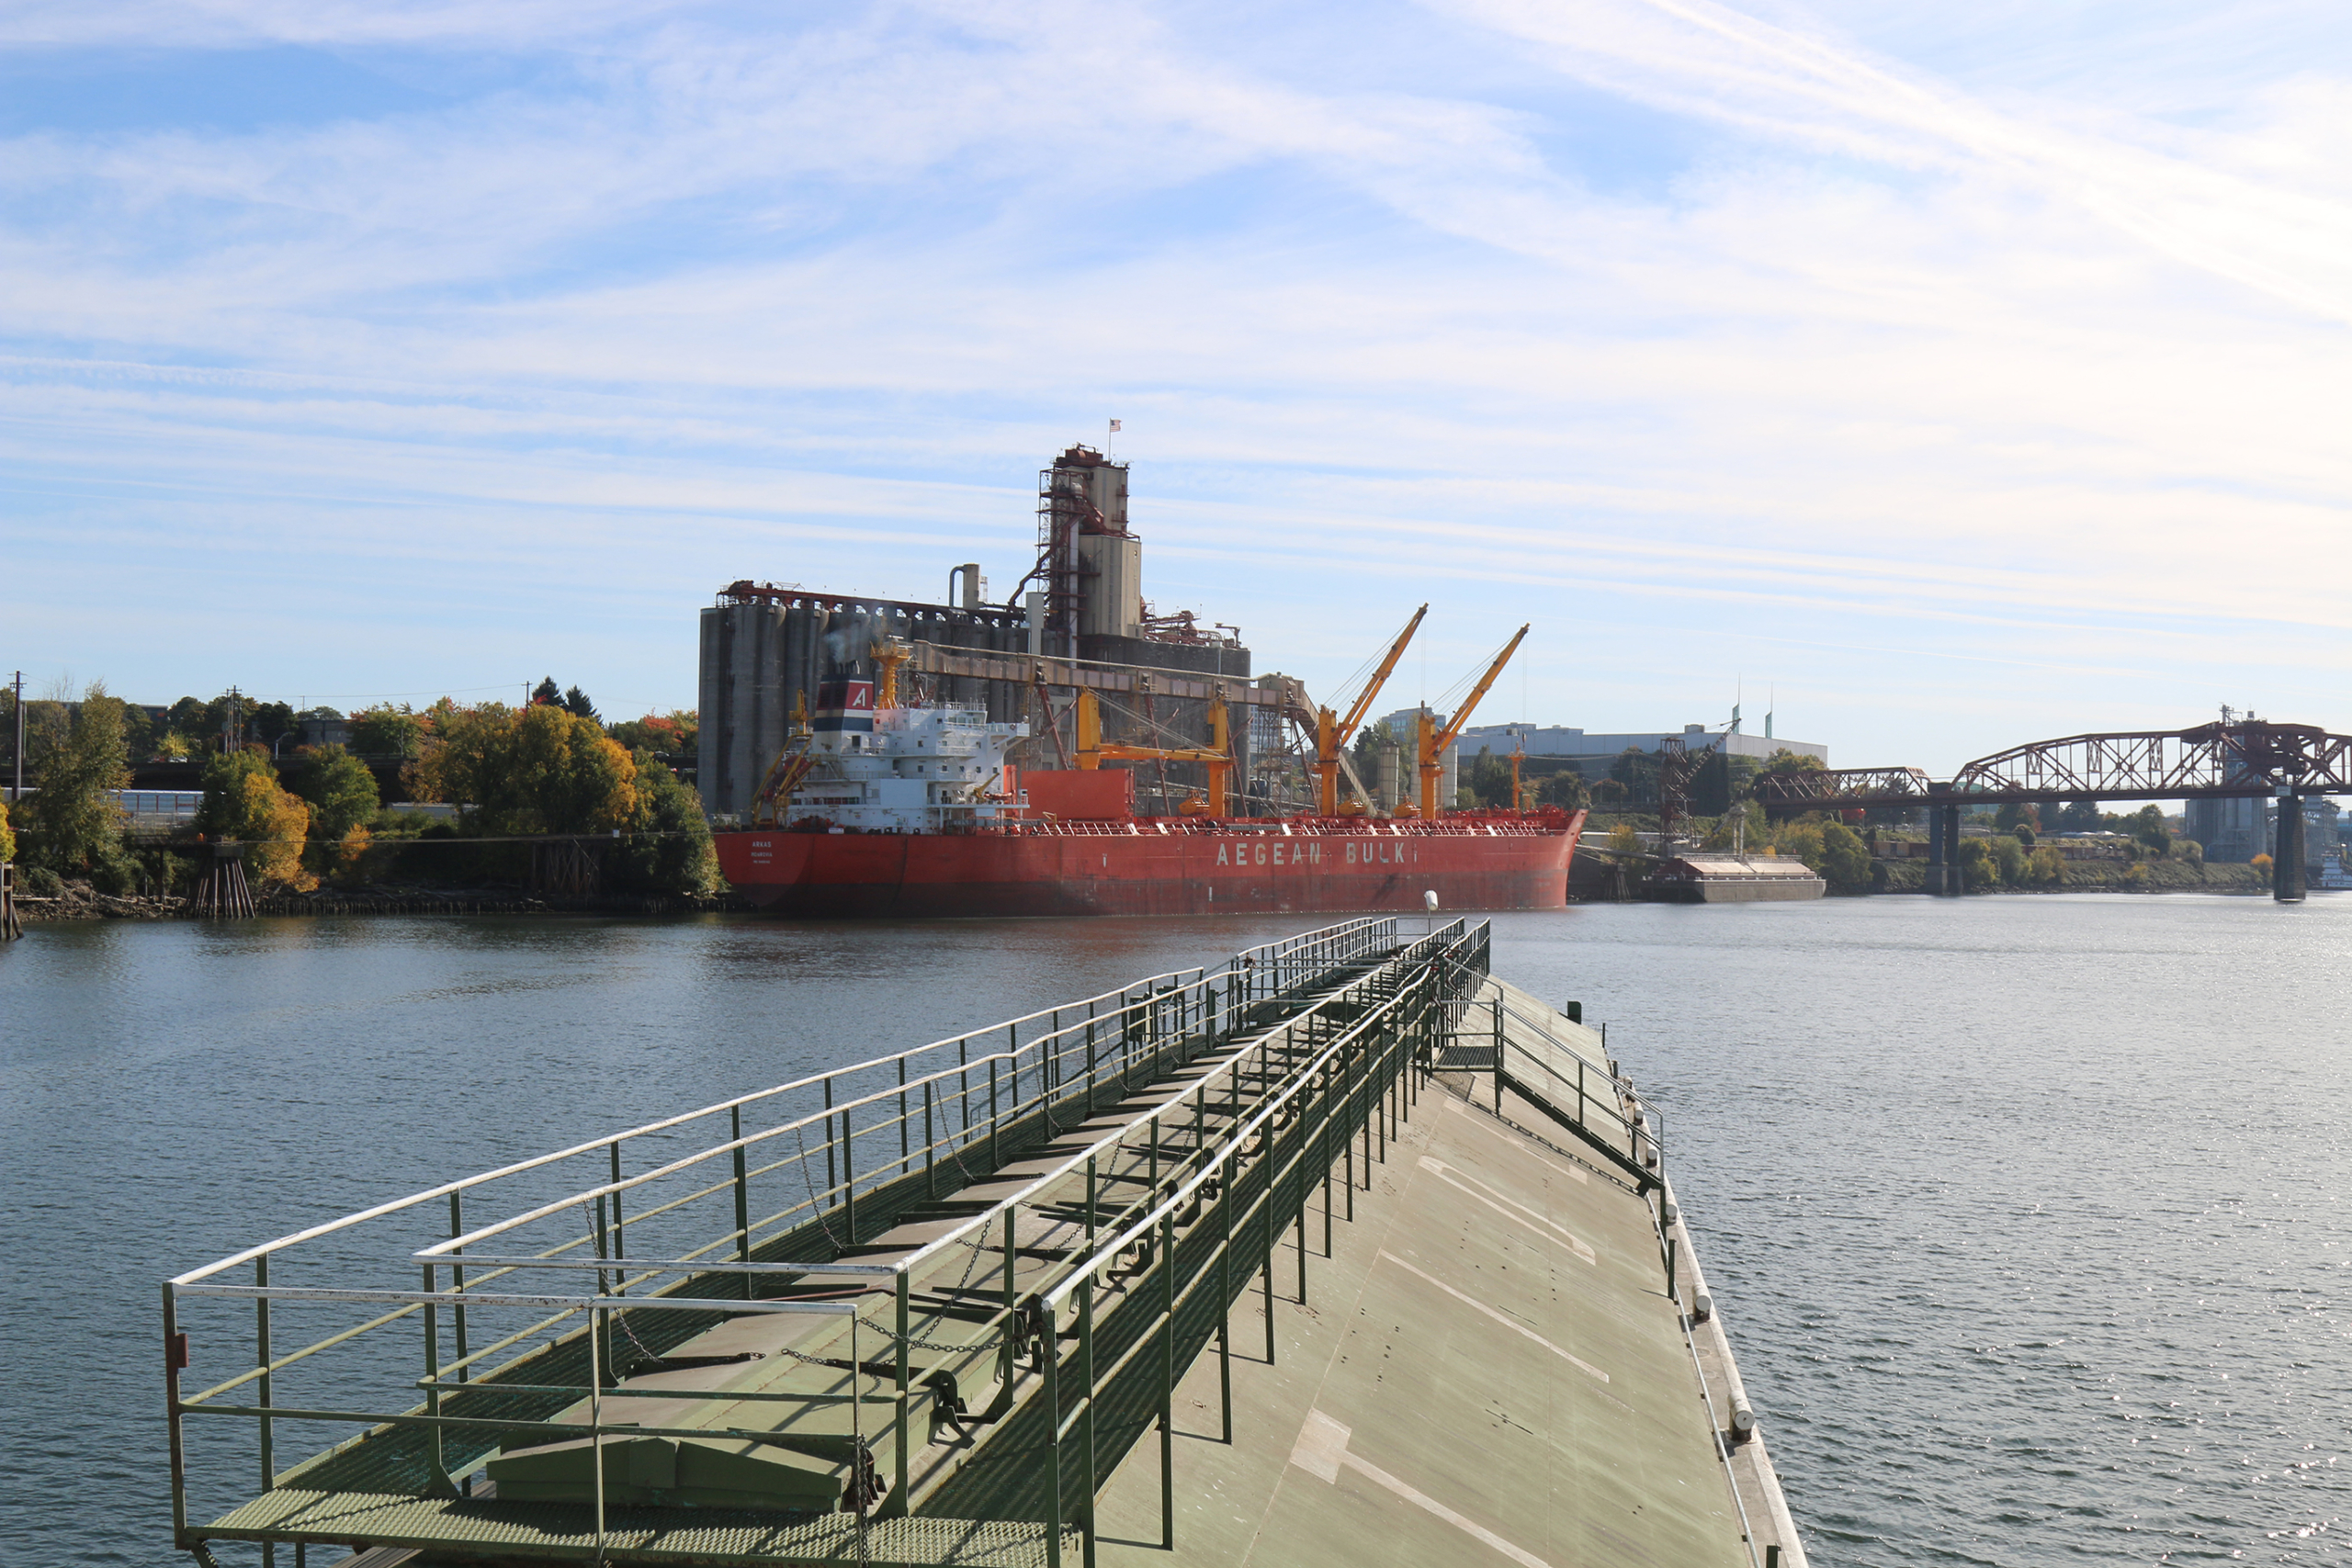
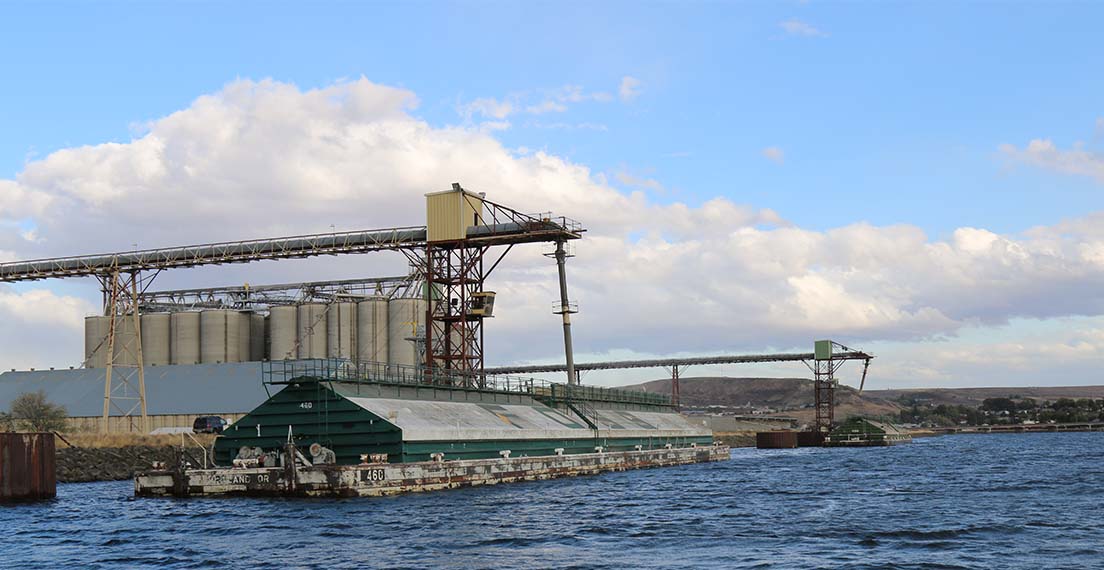
The Port of Lewiston is the most inland port in the U.S, Pacific Northwest. Its placement on the Snake River allows farmers in Idaho and other states to barge their wheat efficiently and affordably. The U.S. competes with six other primary wheat-exporting countries. According to the Foreign Agricultural Service (FAS), the United States is the third-largest wheat exporter in the world. However, for the U.S. to remain competitive with other wheat exporting nations, export prices must remain competitive. Inland transportation costs are a primary factor in determining the competitiveness of U.S. wheat. Using barges to ship grain is one of the most efficient and cost-effective ways that U.S. wheat farmers stay competitive.

Rail Cannot Make Up Difference

All wheat production zones in the U.S. would be impacted, not just those in close proximity to the Lower Snake River Dams system. The U.S. rail system has some severe issues with service and reliability, and in recent years, tariff costs to move wheat have steadily increased. Adding more volume to the system would raise costs for all farmers and lead to a decline in service for a significant portion of all U.S. wheat producers. This would directly impact U.S. wheat’s global competitiveness as an export market.

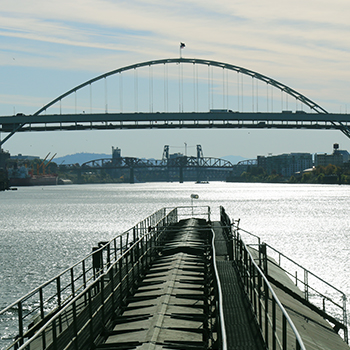
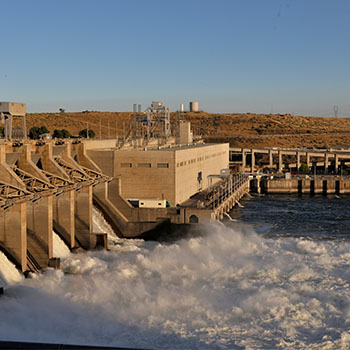
Transporting wheat by barge is an environmentally friendly alternative to rail and truck hauling. One four-barge tow can move as much grain as 144 rail cars or 538 semi-trucks. Removing the dams would not only remove clean hydroelectricity but would mandate more significant carbon emissions as grain handlers are forced to rely on railroads and semi-trucks for long-haul delivery to export facilities in Portland and elsewhere.

Map of the Columbia Snake River System from Pacific Northwest Waterways Association

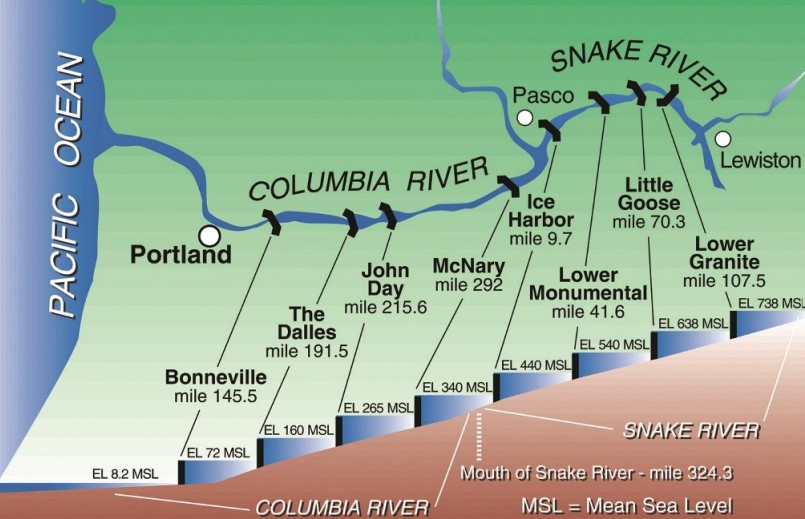
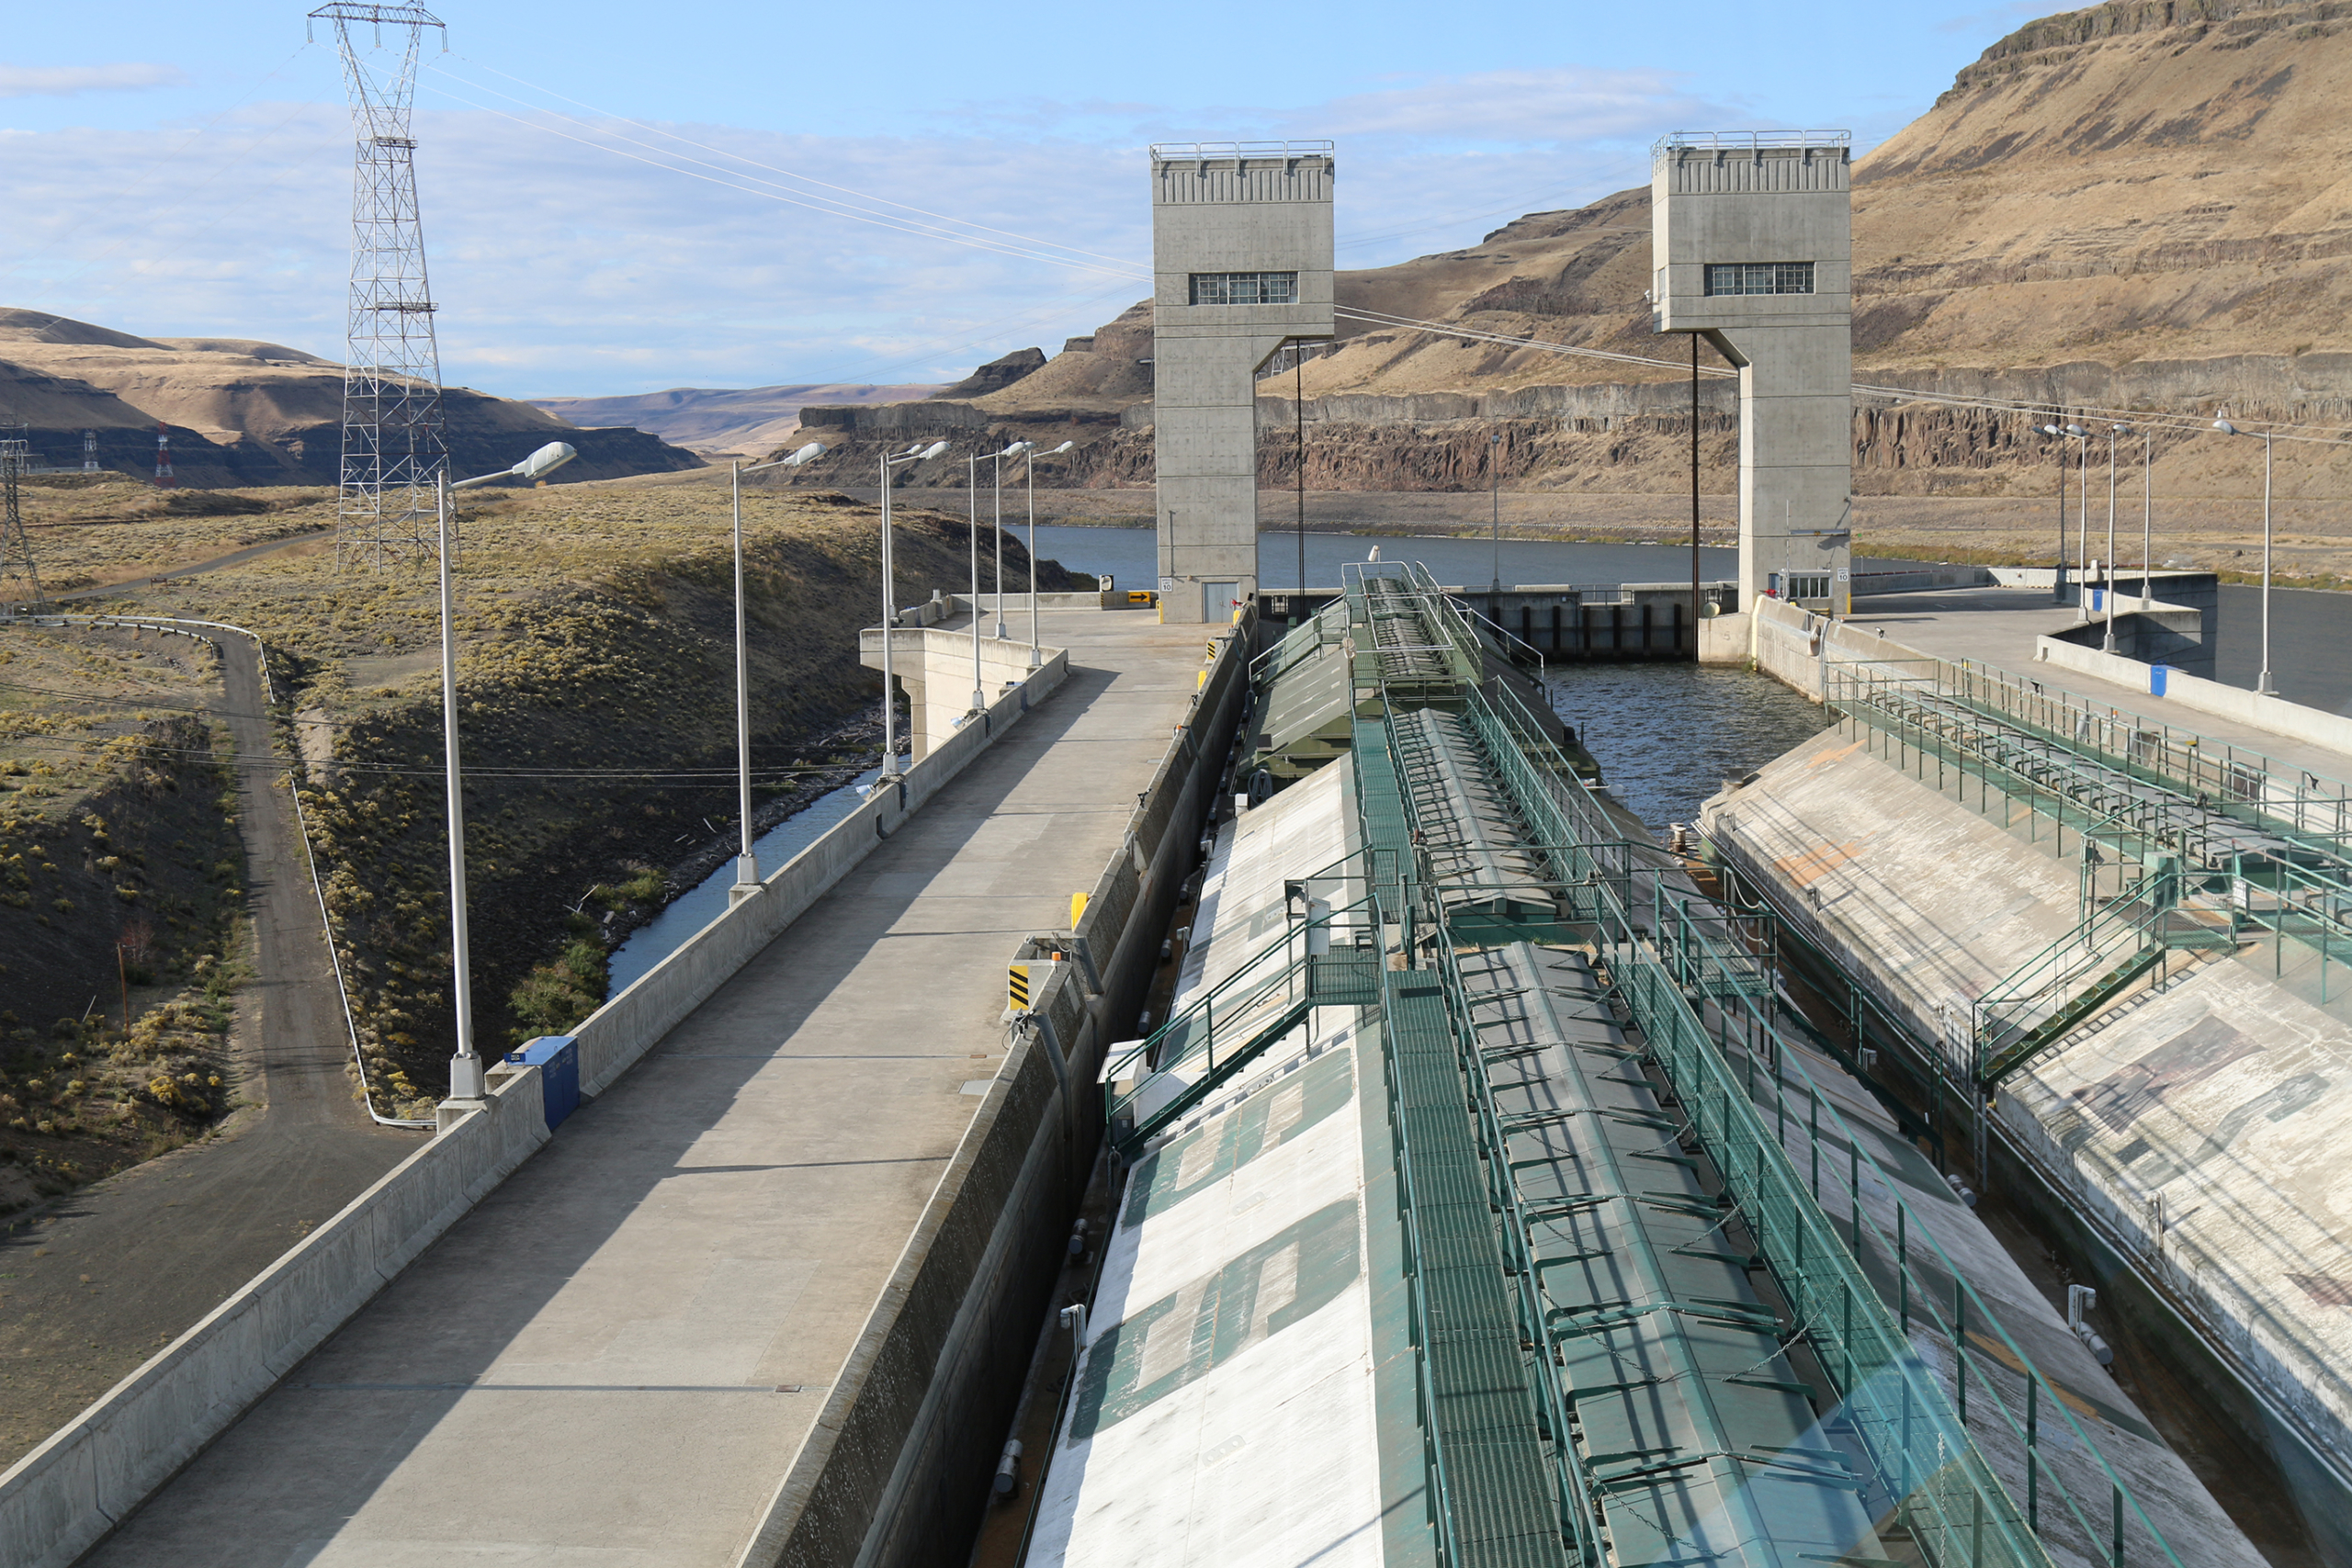
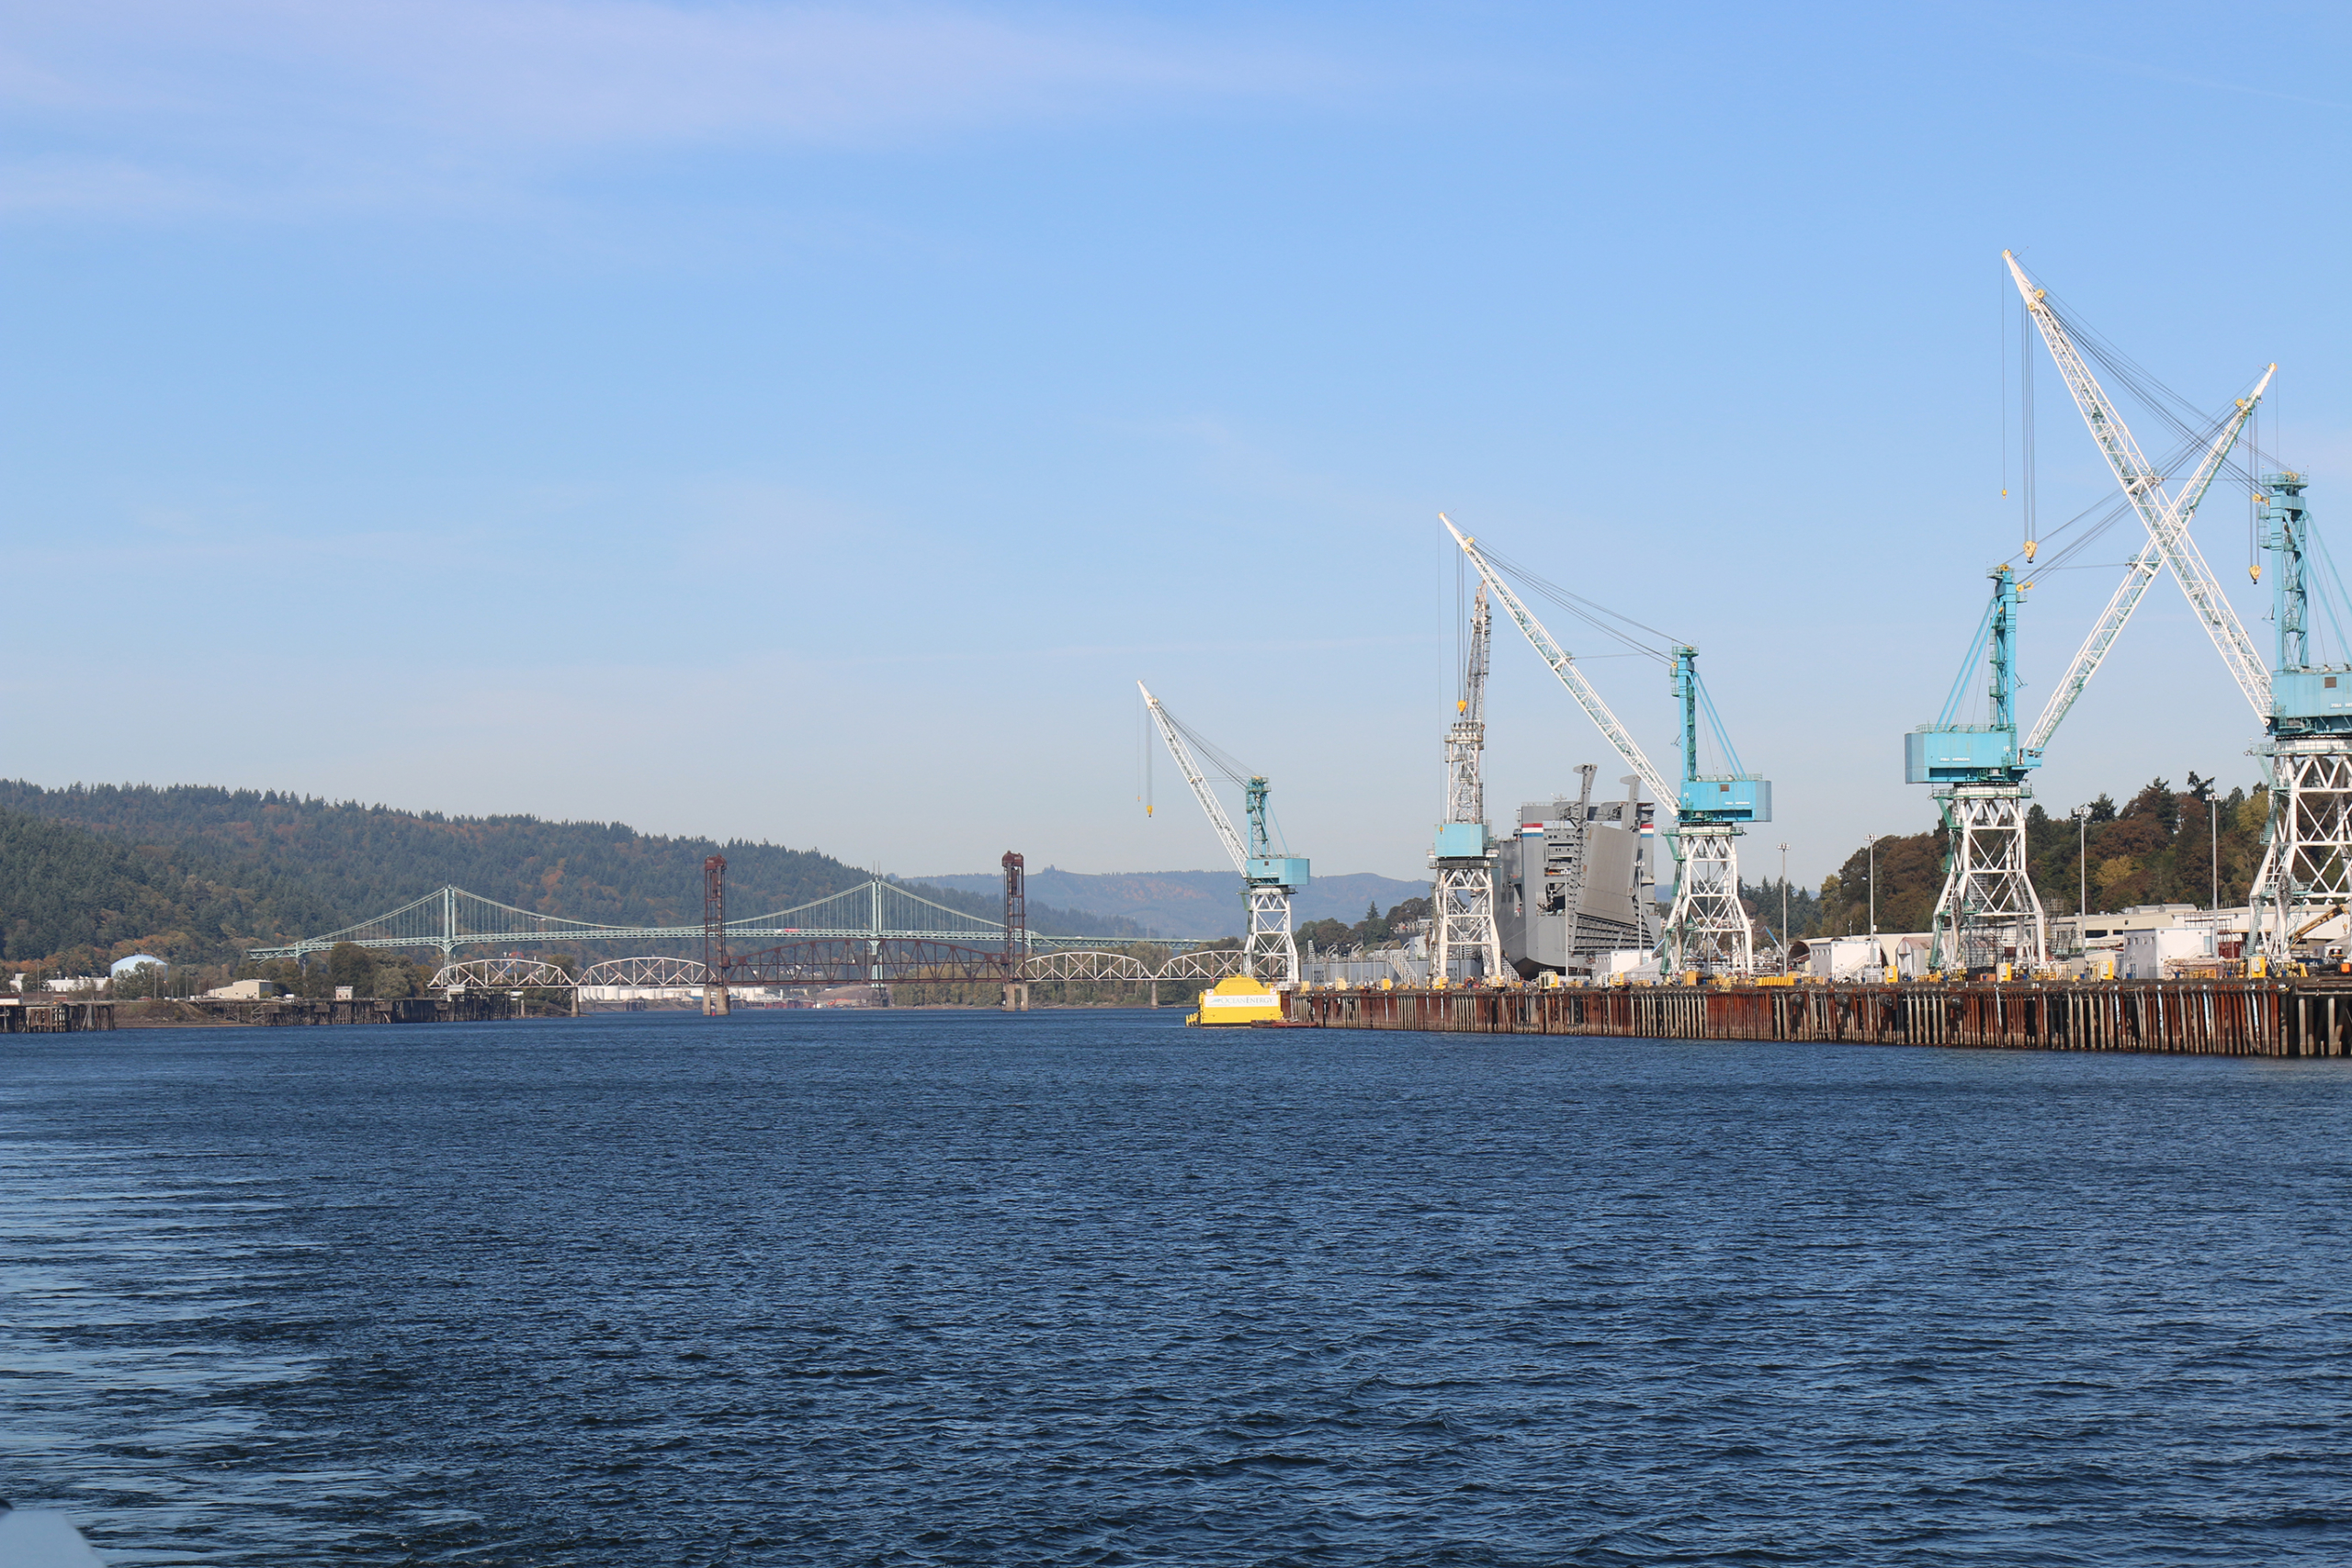
Eight Steps Down. Lock and dam systems on the Columbia Snake River System allow barges to efficiently and safely navigate the 222-meter elevation change from Lewiston, Idaho, to export elevators as far west as Longview, Wash.

More Competition Not Less

The draft report provides no sincere considerations for alternative freight, and what suggestions it does make are unrealistic. While railroads and trucks compete with barge companies to move grain, farmers and grain handlers would be held captive without barges as an alternative.

USW supports the Columbia Snake River System and will continue to emphasize its importance in serving wheat buyers worldwide. Breaching of the dams on the Lower Snake River would have a devastating economic impact on wheat production and market competitiveness, not just in the Pacific Northwest Region, but nationally.

*This article represents public comments by the USW Transportation Working Group to the Lower Snake River Dams Benefit Replacement Report submitted July 11, 2022, by working group co-chairs Jim Peterson, Policy and Marketing Director, North Dakota Wheat Commission, and Charlie Vogel, Executive Director, Minnesota Wheat Research & Promotion Council.


thumbnail

Analysis of the wheat market since February has been underscored by volatility, and no less so for the U.S. soft white (SW) wheat market.

The sudden exit of Ukraine from the export market and the uncertainty of Russia’s wheat exports are recent factors in market volatility. Dry weather is another important consideration for winter wheat markets.

The most recent USDA crop progress report rated 27% of the entire U.S. winter wheat crop as good or excellent, a 3-point drop from last week and the lowest level since 1989 for this time of year. The report encompasses all winter wheat, including SW grown in the Pacific Northwest (PNW). And with summer fast approaching, it is a good time to look at the underlying factors for the 2022 U.S. SW crop.

Conditions Improved

The PNW wheat-growing region remains in some form of drought. Yet crop conditions there are considerably better than in the Plains. Following significantly more winter moisture, spring weather has also returned to normal, with rain and mild temperatures reported in Washington’s Palouse region and north-central Oregon.

Idaho wheat conditions are rated 56% good or excellent. Oregon’s conditions rate 55% good or excellent, and Washington state, the leading SW producer, with 52% of the crop rated good or excellent.

Kernels of soft white wheat

Better moisture gave the 2022 U.S. soft white wheat crop an initial boost. If conditions hold, there will be better yields and quality compared to the 2021 crop. Soft white wheat kernel photo by U.S. Wheat Associates. 

Better Than 2021

Last year, persistent hot and dry weather hit the PNW, impacting both yield and protein content for soft white wheat. According to the U.S. Wheat Associates (USW) Crop Quality Report, the average soft white protein on a 12% moisture basis in 2021 was 11.3%, 15% higher than in 2020 and 16% above the 5-year average. Production was down 28% compared to the 5-year average. In Washington, the leading SW producer, yields were slashed 47% compared to 2020/21.

Ending stocks are especially tight, with the USDA estimating a 26% decline compared to last year. The relatively high cost of the smaller white wheat crop and week-to-week price volatility has translated to reduced SW export volume this year. USDA’s April supply and demand estimate reduced exports by 46%, and the latest USW Commercial Sales report showed soft white exports 50% lower year-to-date at 3.33 MMT.

Planted Area Up

However, USDA expects SW area planted for harvest in 2022 to be 3.56 million acres (1.44 million hectares), up 2% compared to last year. That is good news for SW wheat millers. Production potential and farmer revenue from SW is complicated by higher input costs like fertilizer, and the volatile futures market make it difficult for farmers to determine their best course of action. Even so, the improved conditions this year should benefit both SW customers and farmers.

New Crop Hope

Oregon SW wheat farmer and current USW Chairman Darren Padget is optimistic about the potential in his SW crop this year. He said this year has been much more normal than last year, with moisture being much more consistent and plentiful in the winter and spring. He said that in his area of the PNW, “we are on track for an average crop.”

Glen Squires, Chief Executive Officer for the Washington Grain Commission, said that spring conditions have been wetter and cooler than last year. He did, however, warn that subsoil moisture is about the same as last year, around 40% short or very short. Overall, Squires noted that they are optimistic that crop quality and yields will rebound from last year.

By USW Market Analyst Michael Anderson

The header photo is courtesy of the Washington Grain Commission.

thumbnail

In the increasingly competitive global wheat market, it is important to review the advantages that U.S. wheat delivers to millers and bakers. This post examines the advantages that soft white wheat brings to the market.


Soft white (SW) wheat is the fourth largest class of wheat grown in the United States, with an annual average production over the last five years of 7.51 million metric tons (MMT), or about 276 million bushels. Although SW is the fourth largest class measured by production, it is the third-largest if measured by exports, with nearly 80% of its annual production exported. As with hard white (HW) wheat, SW wheat includes winter and spring varieties increasing the protein range and functionality within the class. U.S. SW wheat has a strong export demand in Asian markets. From specialty products such as sponge cakes, Asian noodles, biscuits, and crackers, to blending with hard red spring (HRS) and hard red winter (HRW) wheat for improving bread color, soft white wheat flour has the versatility to improve the quality and appearance of a wide variety of products.

Milling Advantages

U.S. soft white wheat performs very well on the mill. Arriving at the mill with a high 1,000 kernel weight, average moisture of less than 10%, an average test weight of more than 80 hectoliter mass, and a low quantity of screenings, SW wheat provides millers every opportunity for high flour extraction. The high extraction potential produces a whiter flour due to its lighter bran color. The lower wheat moisture allows the miller to temper the wheat to a lower average target moisture, optimizing flour extraction, particle size, and color.

Baking Advantages

The target market for SW is confectionary products, specifically sponge cakes. However, SW also performs well as a blending flour in a wider variety of products such as Asian noodles and steam bread. The lower moisture content of the flour produced creates an advantage for the baker by increasing the amount of water added while optimizing water absorption and product quality for the consumer. The finer particle size will generally increase the water absorption rate, decreasing mix time and improving production efficiencies. With the fine particle size and starch characteristics, SW flour creates a unique and tender texture for many end-use products. Some markets have successfully blended SW wheat flour with HRS wheat and HRW wheat flour to improve crumb color, texture, and even the loaf volume of pan bread.

As with hard white wheat flour, SW flour also delivers a low polyphenol oxidase (PPO) content. PPO is an enzyme that can cause dough discoloration. Lower PPO content brightens the appearance of any end product.

Sourcing Opportunities

Soft white wheat is defined by three distinct subclasses; soft white, white club, and western white. The three distinct subclasses allow the customer to purchase white club separately from soft white wheat, permitting the creation of different blends for specific uses. Club wheat is unique in that its ultra-soft weak gluten is not tied to protein content and delivering unique starch and protein characteristics that customers prefer for sponge cakes and other specialty confectionary products.

Standard SW may be purchased with a higher protein content (10.5%) to use in blends with HRS and HRW wheat classes to create products with different colors and textures. An important reminder when purchasing SW wheat: Customers generally specify a maximum protein content (max 9.0, 9.5, or 10.5% protein) for sponge cake and confectionary uses versus a minimum protein content typical in hard wheat contracts.  Low protein SW, less than 9.0%, is generally priced more than higher protein greater than 10.5% depending on the year.

Alternatively, the subclass western white wheat is a blend of not less than 10% club and 90% soft white wheat, which allows the customer to define quality targets and adjust the proportion of SW and Club wheat in the blend according to price and quality expectations.

Yield Down, Protein Up in 2021 Crop

It is important to note that the Pacific Northwest (PNW) drought reduced SW production in 2021/22 by 26% and pushed protein levels higher than average. U.S. Wheat Associates (USW) is helping flour millers learn that testing for Solvent Retention Capacity (SRC) is an effective and valuable method for predicting the true performance characteristics of SW and SW subclass flour products, and additional testing is underway to assess performance in the 2021 crop.

U.S. Wheat Advantages

As we highlight each specific class in this series, let us not forget the advantages that all U.S. wheat classes bring to the market. First, and perhaps the most important, is consistency in quality and supply. Although each new crop year brings different challenges and opportunities, U.S. wheat is always available to the global market. Second, U.S. wheat delivers variety. Wheat is a raw material manufactured into a bakery ingredient, flour. The flour made from each unique class of U.S. wheat brings value to the market in the unique quality characteristics to make a variety of baked goods and noodles. It is also important to understand the value of blending flour from one or more types of wheat to optimize the flour performance at a minimal cost.

Each region, country, and culture have wheat-based food products that are uniquely their own. With six unique wheat classes, the United States has the right wheat class to deliver the optimal quality and value for every variety of product on the market.

Learn more about the six classes of U.S. wheat here or leave a question in our “Ask The Expert” section.

By Mark Fowler, USW Vice President of Global Technical Services


Read more about other U.S. wheat classes in this series.

Hard Red Winter
Hard Red Spring
Hard White
Soft Red Winter
Durum

thumbnail

It is 3:00 on a brisk and overcast Tuesday afternoon, and the sun is already low in the sky. I am sitting in the galley of a tugboat — state of the art, I am told. The tugboat has all the amenities any crew would need with five staterooms, a kitchen, a washer and dryer, and even a weight room. There is some tension on board, with a hurry-up-and-wait attitude, when the phone finally rings. The deck mechanic answers and the barge we are waiting on is finally loaded with 1,500 metric tons (MT) of soft white wheat. The motor hums to life, and we start moving, slowly, toward the grain elevator. It is growing dark as two grain barges are tethered together, and we begin downriver from Lewiston, Ida., headed to Portland, Ore. It will be a two-and-a-half-day journey first down the Snake River, connecting to the Columbia River and finally to the Willamette River, to reach our Portland export elevator destinations, about 360 miles.

This river, in general, is very handsome, except at the rapid, where it is risking both life and property to pass.” – From the Journal of Sgt. Patrick Gass, a member of the Lewis and Clark Expedition.

Michael Anderson is picture front, left with the crew of the tugboat crew.

We follow the same route that Lewis and Clark took as the “Corps of Discovery” traveled west. The rivers were different in 1805, untamed by today’s intricate system of dams and locks. The eight dams that we will pass through have made it possible to harness the rivers into a major artery carrying U.S. wheat bound for export from farm to port.

The boat rocks side to side on my first night. It is comfortable, but the unfamiliar feeling makes it hard to settle in. Suddenly the boat lurches, and the light outside gets brighter. The first lock, Lower Granite, comes into view from the deck. Two spotlights illuminate our way as we creep up to the lock. Slowly we approach the brightly lit lock and are guided in along a long concrete wall. The force of the shallow water beneath us is the only thing that keeps the tug and barges moving forward. With inches to spare on either side, we have entered the lock. Behind the boat, a gate rises from underneath the water; it is about three feet above the surface when suddenly the gate stops rising, and our boat starts sinking below the surface. It is a rapid movement, but it continues for a long time. The watermark rises above us as we descend below the surface, protected by thick concrete walls. Finally, we stop moving. We are now 100 feet below the level at which we entered the lock. I walk to the front of the boat just in time to see the gates in front, towering above us, start to open, revealing the river ahead, and slowly we make our way out of the lock and down the river.

As a crew member aboard a tug, your day is not a simple “9-to-5.” With one crew on and one off, the day is broken into shifts of six hours each, from 12 to 6 and 6 to 12. The environment shared by the crew is family-like, cooking meals together and watching TV. Only the person driving the boat, the captain or the pilot, is constantly on watch. The deck mechanics jump into action when the boat enters a lock or when we pick up another barge, and this journey is a four-barge tow, meaning four barges being pushed by one tugboat.

From the bridge, the captain has a sweeping view on all sides, and plenty of sophisticated equipment helps him navigate even when we are surrounded by fog, which in the Pacific Northwest is common. Another lock is just ahead. The boat only moves about nine miles per hour. We fit into the lock with precision, again with just a foot on each side to separate us from the massive concrete walls. Unlike the lock last night, this lock is too short to fit the whole tow in at once, but that is nothing out of the ordinary for this crew. Once the barges are tethered in place, the captain skillfully maneuvers the tugboat like a game of Tetris into a tiny space giving the back of the boat just enough room for the lock keeper to close us in. Again, a large iron gate rises from the water behind us, and like an elevator, we start moving down inch by inch. In front is what looks like a massive garage door. The lock opens, revealing the next stretch of the river ahead.

The mechanics of the lock are simple: we are moving down river with the flow of the water, so when we enter a lock, it is full of water. The lock seals behind us, and a valve is released to allow the water to rush out of the lock. The tow itself is being moved to the same level as the river we are moving down. Once the tow is at the same level as the water outside the lock, the valve is closed, and we wait for the massive concrete door ahead of us to open so the tow can move out. It is a similar procedure for ships going upriver against the flow, but instead of the valve releasing water, the valve fills the lock. It takes about 30 minutes to pass through each lock.

The Columbia Snake River System is a superhighway for moving wheat and other agricultural products from farm to market. The barges and rail lines that run on both banks of the Columbia River carry more than 55% of all U.S. wheat bound for export each year. Barges are the most efficient way to move large volumes of grain, making the river system a cost-effective and “green” logistical option. The Army Corps of Engineers maintains the lock system; its history goes back to the 1930s when President Franklin Roosevelt personally inaugurated Bonneville, the first of the eight dams and locks east of Portland.

After about 60 hours on board the tugboat, we arrive in Vancouver, Wash., on the north bank of the Columbia River. We drop off two barges at an export elevator and proceed west again, up the north-flowing Willamette River that bisects Portland. It is my third river in a week, and we are taking the last barge to an export elevator just across the river from the U.S. Wheat Associates (USW) West Coast Office. There is a vessel at berth waiting for the wheat we carry. The crew drops the barge, and me, at the elevator. I walk up a set of metal stairs connected to a hoist and hop off, touching land for the first time since Tuesday. I walk across the river on Portland’s Steel Bridge, under which the wheat from our tow will pass on its way overseas, to my office.A tugboat pushes a grain barges down the Snake River on its way from Lewiston, Idaho to Portland, Ore.

By Michael Anderson, USW Market Analyst

This story was originally published on October 21, 2019.

thumbnail

Marketing year 2021/22 (June to May) has been record-setting to date. USDA estimates of global production, trade, and consumption have all outpaced previous years. However, since it’s initial 2021/22 World Agricultural Supply and Demand Estimates (WASDE), USDA has adjusted its forecast down, led by a 17 million metric ton (MMT) reduction in global wheat production by December. Ending stock estimates for the world’s top exporters are also down.

The weather has played a key role this year in lowering production in Canada, Russia, and the United States. Quality concerns following wet harvests in the EU and Australia have affected milling-quality wheat and supported markets. And Russia’s use of an export tax and now plans for an export cap have tightened supply while adding to prices. Other factors, including ballooning ocean freight rates, natural disasters, Covid-19 restrictions, and smaller domestic production in some key countries, have helped prices climb to multi-year highs (see chart below).

Chart of Wheat Exporting Country Stocks and Wheat Price Relationship

Lower stocks and higher prices dominated the first half of the wheat marketing year 2021/22. USDA steadily reduced its global production estimates from June to December mainly from some large exporting countries. Given record world wheat use, the 2021/22 average export price to date for ordinary U.S. hard red winter wheat from the Gulf ($301/MT, above) reflects the situation. Sources: USDA and USW Price Report.

As U.S. Wheat Associates (USW) marks the middle of the 2021/22 export calendar, the following are snapshots of the influential factors for major wheat exporters and how USDA estimates have changed.

Canada

Weather was a strong factor this growing season for Canadian wheat. In the Prairie Provinces, the Normalized Difference Vegetation Index (NDVI), which measures plant health, had the wheat crop maturing four weeks earlier than normal. Hot and dry weather withered the all-wheat estimate to 21.65 MMT, down 33.5% compared to the 5-year average. StatsCan’s wheat estimate of 21.6 MMT is the lowest all-wheat production since 2007. Durum production took an even steeper cut to 2.7 MMT, the lowest ever recorded for the country. Exports are also projected lower. The latest WASDE report forecast Canadian wheat exports to total 15 MMT, 43% less than last year. Year-to-date, Canadian wheat exports are running 38% behind 2020.

Australia

The South Pacific country continues to rebound from a drought-ravaged 2019/20 crop with expectations for a second bumper crop in a row. The latest WASDE report put Australian wheat production at 34 MMT, 8% higher than November’s report and 41% higher than the 5-year average. Exports too were projected higher at 25.5 MMT. Data on quality is still unknown because the Australian crop is in mid-harvest. However, wet weather has led to concern about the final volume wheat that meets milling quality standards.

Russia

Russian wheat production has been on a downward slope since June when USDA estimates of production stood at 86 MMT. The latest string of WASDE reports have cut that estimate to 75.5 MMT with 36 MMT forecast for export. Year-to-date, Russia has exported 19.4 MMT of wheat, 54% of the overall estimate despite a wheat export tax that increased to $91/MT on Dec. 10, more than double in the rate last July. On top of the fluctuating export tax, Russia is considering a wheat export quota set to begin in mid-February.

Ukraine

The Black Sea country has had an impressive production year, up 30% year-on-year, and exports running 17% ahead of last year’s pace at 14.5 MMT. Ukraine’s agriculture ministry signed an agreement with grain traders capping wheat exports at 25.3 MMT, about 1 MMT higher than the latest WASDE’s export projection.

European Union

The EU also saw higher production this year than last, driven mostly by impressive yields in Romania and Bulgaria. Exports are running 11% ahead of last year’s pace and the EU is expected to replace Russia as the year’s leading wheat exporter. Coceral, a European trade association, forecast that the 2022 soft wheat crop will drop to 125.4 MMT, 3.4 MMT less than their 2021 figure despite the area planted being only marginally reduced. Yields however are estimated to be down 3%.

Argentina

The Buenos Aires Grains Exchange (BAGE) expects the biggest wheat harvest ever for the South American country. Higher than anticipated yields have traders estimating a 22.1 MMT wheat crop, higher than USDA’s estimate of 20 MMT. Even so, the government has taken steps to discourage the pace of export license registrations.

United States

U.S. wheat production is forecast down 5 MMT this year after dry weather in the Pacific Northwest (PNW), Montana, and North and South Dakota withered average yields for soft white hard red spring and Northern durum. In its latest WASDE report, USDA said, “U.S. export prices are expected to remain elevated the rest of 2021/22, further diminishing U.S. competitiveness.” The December WASDE forecasts U.S. wheat exports to total 22.8 MMT, the smallest total in 7 years if realized.

Imports Up, Too

As wheat prices continue to rise, major wheat importers are outpacing their purchases compared to 2020/21 (see chart below). For example, Egypt made its largest single purchase of wheat ever this year, buying 600,000 MT and paid $90/MT more than the average price paid a year ago. Iran’s wheat imports are up 218% compared to last year, while Turkey’s import demand is up 36%.

Graph of wheat import volume for 10 countries at the same date the past two years.

Wheat import volumes are up in several countries even as global wheat prices continued rising. Source: USDA

Looking ahead to the second half of 2021/22, many analysts see little change in ending stocks but continued market volatility given the many unknown factors in the global economy including logistical challenges and pandemic uncertainty.  Producers and buyers now look to the potential for increased wheat acres (USDA forecasts a 5% increase in 2021/22) and better growing conditions to help add stability to the global wheat market in 2022/23.

By Michael Anderson, USW Market Analyst

thumbnail

The Pacific Northwest (PNW) experienced challenging drought conditions in the 2021 soft white crop year, resulting in a wheat crop with higher protein and lower yields. This year’s SW crop has weak to medium gluten strength and acceptable finished product characteristics. SW is especially suited for use in cakes, pastries, cookies and snack foods. The high protein segment of the SW crop provides opportunities in blends for crackers, Asian noodles, steamed breads, flatbreads and pan breads. With very weak gluten strength, Club White is typically used in a Western White blend with SW for cakes and delicate pastries.

2021 U.S. soft white sampling data

Weather and Harvest

Winter planting conditions were generally good, including sufficient moisture overall to develop a strong stand; however, less winter moisture impacted crop development coming out of dormancy. Spring planting conditions were poor due to the very dry conditions and excessive heat throughout much of the PNW.

As the crop developed, extreme sustained heat in late June accelerated crop maturity in many areas, which put the harvest timeframe generally ahead of average. Production of the 2021 PNW SW crop is estimated at 4.3 MMT, the lowest for the region since 1966.

Buyers are encouraged to review their quality specifications to ensure that their purchases meet their expectations. This will be a good year to understand SW protein performance versus protein levels; your local U.S. Wheat Associates (USW) representative can help.

2021 Crop Highlights:

  • Grade – the overall averages are U.S. No. 2 Soft White and U.S. No. 1 White Club.
  • Test Weight averages are 59.3 lb/bu for SW and 59.7 lb/bu for WC.
  • Wheat Protein (12% mb) ranges from 8.1 to 11.9% for SW, with the weighted average 11.3%. Club averages 11.5%.
  • Wheat Moisture ranges from 8.7 to 9.7% for SW with a weighted average of 8.8%. Club averages 8.0%.
  • Wheat Falling Number average is 319 sec or higher for all SW composites and 345 sec for Club.
  • Wet Gluten contents for SW flour range from 8.4 to 24.5%, depending on flour protein content. Club averages 6.1%.
  • SRC lactic acid values range 91 to 109% for SW, indicating weak to medium gluten strength.
  • Amylograph peak viscosities for SW are between 472 and 542 BU for all composites. Club averages on amylograph peak viscosity of 529 BU.
  • Farinograph SW absorptions range from 51.5 to 53.1% with 2.2 to 2.6 min stability times, showing desirable weak dough characteristics. Average Club farinograph absorption is 51.1% with a stability of 1.1 min, showing very weak dough characteristics typical for Club.
  • Extensograph SW data at 45 min show maximum resistance in the range of 174 to 284 BU, extensibility 16.8 to 18.4 cm and area 46 to 79 cm2. Club extensograph 45 min maximum resistance, extensibility, and area are 107 BU, 17.2 cm, and 23 cm2, respectively.
  • Alveograph SW ranges include P values 37 to 42 mm; L values 57 to 68 mm; and W values 63 to 78 (10-4 J). Average Club alveograph P, L and W values of 27 mm, 43 mm, and 29 (10-4 J), respectively.
  • Sponge Cake SW volumes range from 1077 to 1104 cc, depending on protein content, with a weighted average of 1081 cc. Total sponge cake score is 33 to 49, with a weighted average of 35. Club sponge cake volume is 1070 cc with a total score of 34. Scores were lower due to firmer textures.
  • Cookie SW diameters are 8.6 to 8.7 cm with spread factors of 10.1 to 10.4. Club diameter and spread factor are 9.1 and 12.6 cm, respectively.
  • Chinese Southern-Type Steamed Bread specific volumes are 2.2 to 2.4 mL/g with total scores less than the control score of 70.0. Club specific volume is 2.3 mL/g with a total score below the control.

Read more about the 2021 soft white wheat crop here and view the full regional report here.

2021 Crop Quality Data on Other U.S. Wheat Classes

Hard Red Winter
Hard Red Spring
Soft Red Winter
Northern Durum
Desert Durum® And California Hard Red Winter
Hard White

thumbnail

There is an easily understood expression in English that “you cannot judge a book by its cover.” Applied to the new 2021/22 U.S. soft white wheat crop that is good advice for the world’s flour millers and wheat food producers.

The persistent Pacific Northwest (PNW) drought is expected to lower yields and push 2021/22 SW protein levels higher than average. As USW Bakery Consultant Roy Chung says, however, protein level alone does not say everything about soft white end-quality performance.

Instead, U.S. Wheat Associates (USW) is helping flour millers learn that testing for Solvent Retention Capacity (SRC) is the most effective and valuable method for predicting the true performance characteristics of flour for biscuits (cookies) and crackers.

The SRC method, approved by the American Association of Cereal Chemists (56-11.02), examines the characteristics of glutenin, gliadin and arabinoxylan and the level of starch damage in flour. These values describe the flour’s ability to absorb water during the mixing process and its ability to retain or release that water during and after the baking process, among several other performance characteristics.

The combined pattern of the four component SRC values establishes a practical flour quality profile useful for predicting functionality, giving the miller and baker a ‘fingerprint’ of U.S. soft white (SW) and soft red winter (SRW) wheat flour end-quality performance.

Image of a video describing SRC analysis of soft white wheat and other classes

Noted cereal chemist Dr. Art Bettge, ADB Wheat Consulting, described SRC use and interpretation in-depth in a video lecture for USW’s 2020 Crop Quality Seminars.

“While rheological analysis tools measure the combined effect of the components in flour, individual component functionality, measured by SRC, gives a better picture of whether you are going to get the desirable performance from the flour for the product you want to make,” Chung told a large audience of millers and bakers in a USW webinar on SRC in June 2021.

With a more complete understanding of the functional value of wheat proteins, carbohydrates and other properties, flour milling quality control managers will have additional information to evaluate the characteristics more accurately of U.S. soft white wheat and Western White (a blend of SW and a minimum 10% white club) this year compared to competing supplies.

Test of cookie spread using soft white wheat flour and other low protein flour to show protein % does not always predict performance.

These test results, provided by USW Bakery Consultant Roy Chung, show cookie spread increases and then declines as the flour protein percentage lowers, demonstrating that protein percentage alone is not an accurate predictor of performance.

Clean Label Input

“In addition, more wheat food manufacturers are looking for ways to ‘clean up’ their ingredient labels,” said USW Regional Technical Director Peter Lloyd. “USW can show SRC results to millers and bakers that prove flours from U.S. soft white wheat and SRW wheat can make beautiful end products without adding any ‘magic powder’ like enzymes that have to be added to medium protein wheat flour to make weak gluten products.”

USW has helped flour mills understand the advantages of SW by introducing SRC analysis and training mills to use the tool to expand their business. Vietnam is one example, where several flour mills use SRC analysis of flour products milled from SW to demonstrate how end-product performance is improved compared to flour milled from alternative wheat supplies.

“Our baking experts have already had several sessions with flour millers across South and North Asia about the benefits of evaluating flour from SW with SRC over protein levels alone,” said USW Regional Vice President Matt Weimar. “We were also pleased with the number of millers who participated in the June webinar on SRC, in which Roy Chung and Tarik Gahi, our Milling and Baking Technologist, demonstrated the SRC method. We also had a well-attended second session in July featuring Peter Lloyd discussing how to use SRC data to blend flour streams for better performance and profit.”

Excellent SW Will Be Available

Buyers, millers and end-users can be reassured that excellent quality SW is available even with a short 2021/22 crop. Beginning stocks carry in 1.91 million metric tons of total U.S. white wheat following a 2020/21 PNW SW crop with excellent performance characteristics. Local USW offices and U.S. export grain companies are also prepared to help their customers develop tenders that will deliver the wheat qualities needed at the highest value possible.

thumbnail

Hot, dry weather following a parched fall and a winter with less snow in some areas has many parts of Washington, Oregon and Idaho experiencing some of the driest weather in a generation. Much of the area that grows spring and winter soft white (SW) and white club wheat is experiencing some form of drought. All eyes will be on USDA’s first estimate of new crop SW production in its July World Agricultural Supply and Demand Estimates report, although a reduction in yield potential and concerns about protein levels are already anticipated.

The market has reacted to the weather with FOB prices for ordinary SW up $140.00 per metric ton ($4.00 per bushel) more than a year ago. Demand for the 2020/21 SW crop was quite strong and ending stocks of 1.31 million metric tons are half of what they were in 2019/20. The stocks-to-use ratio for SW ended the year at only 13%.

Now, the hot dry weather leaves farmers unwilling to forward contract new crop sales as they struggle to identify what volume they will produce and because dry conditions tend to increase protein, what protein levels they will be able to offer. Traders are cautious because the drought’s effect on protein levels could make securing lower protein SW difficult. It is important to remember that SW protein levels have been elevated in some past years. Your local U.S. Wheat Associates (USW) office is an excellent resource to help you identify how to get the most value from every new crop.

Showing the U.S. Drought Monitor for the Western states.

Extreme drought is intensifying in the Pacific Northwest and throughout the western United States.

Michelle Hennings, Executive Director of the Washington Association of Wheat Growers, recently noted that while winter planted SW is stressed with lower yield potential, spring planted SW has had so little moisture some farmers may not have any harvest.

Washington state, which accounts for around 50% of the Pacific Northwest (PNW) SW crop, has received only half of its usual average rainfall according to NOAA’s National Centers for Environmental Information and areas falling into the drought category makeup well over half the state. Areas rated in extreme drought are increasing fast week-over-week and winter wheat conditions in Washington are rated 15% good to excellent.

Karin Bumbaco, Assistant State Climatologist, University of Washington, recently noted that the drought in the state has expanded quickly. Just three months ago none of Washington was in extreme drought versus today when more than 23% of the state – and almost all the state’s wheat country – falls into the category (see the PNW SW wheat production area above from the interactive U.S. wheat export supply system map on www.uswheat.org).

Driest in More than 40 Years

The once-in-a-generation drought led one farmer to observe “if you can get an average crop, consider yourself lucky!”

Darren Padget, a dryland wheat farmer in north-central Oregon and the current USW Chairman, noted that harvest may come early this year. The lack of rain has matured his crop enough that harvest, which usually comes at the end of July, may start in less than a month. Padget also mentioned that it is the driest weather he has seen since 1977, a year many farmers remember when looking for a comparison to this year. In Oregon, which accounts for around 20% of the PNW SW crop, winter wheat conditions are rated 11% good to excellent.

Some Good to Excellent Wheat

Idaho, which accounts for around 30% of the PNW SW crop, has also been very dry. Similar to neighboring states, spring planted SW in Idaho is severely stressed, especially on non-irrigated fields. However, some wheat in Idaho is grown under irrigation and farmers there are more optimistic about the condition of fall planted SW fields. In fact, USDA’s latest report puts 44% of SW winter wheat in good to excellent condition.

Despite the challenges to the 2021/22 PNW SW crop, many farmers do have crop insurance and the state governments are also considering other ways to help farmers through this challenge, and USW is there for overseas buyers who have questions and concerns.

Producers, by nature, remain optimistic. One producer in Washington state put it best: “…we are not going to give up.”

By Michael Anderson, USW Market Analyst

thumbnail

The new U.S. winter wheat crop is rapidly developing and U.S. Wheat Associates (USW) will publish its first “Harvest Report” for marketing year 2021/22 on Friday, May 14.

USW Harvest Reports are published every Friday afternoon, Eastern Daylight Time, throughout the season with updates and comments on harvest progress, crop conditions and current crop quality for hard red winter (HRW), soft red winter (SRW), hard red spring (HRS), soft white (SW) and durum wheat.

Anyone may subscribe to an email version of the “Harvest Report” at this link. USW includes links in the email to additional wheat condition and grading information, including the U.S. Drought Monitor, USDA/NASS Crop Progress and National Wheat Statistics, the official FGIS wheat grade standards and USDA’s World Agricultural Supply and Demand Estimates report. Harvest Reports are also posted online on the USW website here.

The weekly Harvest Report is a key component of USW’s international technical and marketing programs. It is a resource that helps customers understand how the crop situation may affect basis values and export prices.

USW’s overseas offices share the report with their market contacts and use it as a key resource for answering inquiries and meeting with customers. Several USW offices publish the reports in the local language. Additional links to Harvest Report are available on USW’s Facebook, Twitter and LinkedIn pages.

USW wants to thank and acknowledge the organizations that make “Harvest Reports” possible, including:

thumbnail

Each of the six U.S. wheat classes brings unique advantages to the increasingly competitive global wheat market.

First, and perhaps the most important, is consistency in quality and supply. Although each new crop year brings different challenges and opportunities, high-quality U.S. wheat is always available to the global market.

Second, each class of wheat provides the ingredients needed to produce so much of the world’s food. U.S. Wheat Associates (USW) Vice President of Global Technical Services Mark Fowler makes the point this way: “Our six U.S. wheat classes give our customers the opportunity to optimize taste, texture and appearance of thousands of food products made with flour or semolina.”

Every region, country and culture have wheat-based food products that are uniquely their own. The United States has the right wheat class and quality to make every one of those products more appealing and valuable.

In the video below, Mark Fowler talks about each of the six wheat classes grown in the United States, their definition, uses and their functional characteristics.

Learn more about the six classes of U.S. wheat here or leave a question in the U.S. Wheat Associates’ “Ask The Expert” section.

Interested in more USW video content? Visit our video library at https://vimeo.com/uswheatassociates.


Read more about other classes of U.S. wheat in this series.

Hard Red Winter
Hard Red Spring
Hard White
Soft White
Soft Red Winter
Durum