thumbnail

By Steve Mercer, USW Vice President of Communications

USDA market analysts cited Iraq’s major purchase of hard red winter (HRW) wheat as the specific basis for a significant drop in U.S. ending stocks in the November World Agricultural Supply and Demand Estimates (WASDE) report. The report correspondingly put its total U.S. export forecast for 2017/18 up 0.7 million metric tons (MMT) to reach 27.2 MMT. This would be down 5 percent from 2016/17 but 2 percent above the 5-year average, if realized.

The ending stocks forecast continues to be the primary plot of the 2017/18 global wheat market story. The WASDE report noted that even with slightly lower supplies and higher use, ending stocks are still expected to hit a record level.

USW Market Analyst Stephanie Bryant-Erdmann, who is currently on an international assignment, shows in USW’s latest Supply and Demand Report that global ending stocks are projected to reach a record level: 268 MMT, or 5 percent higher than 2016/17, if realized. Estimated Chinese ending stocks of 127 MMT account for 48 percent of global ending stocks, which is 58 percent greater than the 5-year average.

Bryant-Erdmann provides a more nuanced analysis of global stocks by charting the current global stocks-to-use ratio with and without China’s stocks, which are not likely to move to export. She shows that the 2017/18 ratio drops about 64 percent from 36 percent to 22 percent without Chinese stocks. More significant, though, is the historical look, showing that exportable stocks are on a three-year downward trend. In fact, Bryant-Erdmann shows that exporter ending stocks are expected to fall 5 percent year over year to 74.3 MMT, and ending stocks in importing countries are forecast to fall to 66.0 MMT, 5 percent below the 5-year average of 70.5 MMT.

thumbnail

By Elizabeth Westendorf, USW Assistant Director of Policy

In 2006, the United States signed the U.S.-Morocco Free Trade Agreement, making it the first U.S. free trade agreement (FTA) that did not fully eliminate tariffs on wheat. Instead, the FTA included a tariff rate quota (TRQ) for U.S. wheat, which is now set at 360,000 metric tons (MT) per year. Over the years, this TRQ has presented a challenge to U.S. wheat exports to Morocco. It is typically only briefly opened once a year, which makes it difficult for Moroccan customers to gain preferential tariff access to high quality U.S. wheat.

U.S. government officials have consistently raised this issue with their Moroccan counterparts, and this year the TRQ administration was improved to allow access to U.S. wheat exports multiple times per year. The first tender of the year filled because of a poor wheat harvest in Morocco in 2016, but Morocco only tenders for 90 percent of the tender at once because buyers can bid 10 percent over that amount in the tender. In October, Morocco agreed to issue a second tender for the remaining 30,000 MT of the TRQ. That tender was filled, and the wheat will arrive in Morocco in December. With the exception of last year and early this year, when Morocco had a poor wheat crop and needed to import more wheat, this is the first time in years that a significant quantity of U.S. wheat has gone in under the TRQ, and these efforts ensure that U.S. wheat will have improved access to the Moroccan market in the future.

Trade agreements do not automatically work perfectly, but this cooperative solution to a problem in the U.S.-Morocco FTA is an important example of the benefits of working within the FTA framework. Trade agreements are a vital tool for opening and expanding new markets and help reduce costs for international wheat buyers. They are especially important in the increasingly competitive global wheat market.

thumbnail

Recently, Vietnam’s government advised the USDA that it would lift restrictions on imported U.S. food grains and feed grains. This change helped open an opportunity for Vietnamese flour millers who recently bought a large volume of U.S. soft white (SW) wheat, the first substantial sale of U.S. wheat to the Vietnam market in several months.

On Dec. 1, 2016, Vietnam implemented a requirement that all shipments of U.S. wheat, corn and distillers dried grain solids (DDGS) be fumigated with a product that U.S. export elevators are generally unable to use in bulk shipments. Vietnam now allows treatment with a generally accepted fumigation product throughout the global grain trade, to enter the country. An official phytosanitary certification from the USDA Animal and Plant Health Inspection Service will also be required.

USW continued to provide trade service to Vietnamese flour millers after this restriction was implemented. For example, Vietnamese flour milling executives recently joined a team of millers visiting the United States to learn more about U.S. wheat quality and the supply chain.

“Several of our staff worked with the grain trade, U.S. government agencies and our customers to develop workable solutions to this restriction,” said USW Vice President of Overseas Mark Fowler. “We appreciate their work and the cooperation of the U.S. and Vietnamese governments. We look forward to more normal trade with these customers.”

thumbnail

By Megan Meyer, PhD, International Food Information Council (IFIC) Foundation

Original article first appeared in March 2017

[IFIC is] rounding out National Nutrition Month [March], with a new Sound Science analysis. In fact, this Sound Science piece includes a double feature. Recently published in the American Journal of Clinical Nutrition, a pair of studies focused on a variety of health benefits associated with whole grain consumption, specific to the body weight and microbiome. Whether you are a carb enthusiast, carb skeptic, or somewhere in the middle, it’s important to take note new scientific findings and see how they align, enhance, or refute the current body of evidence. This will help you get the whole (grain) story.

A Closer Look at The Science

First up, the study by Karl et al., examined the effects of whole and refined grains on energy and metabolism endpoints. The study enrolled 81 participants in an eight-week study. The participants were divided into two groups: a whole grain group and refined grain group. The diets differed only in the types of carbohydrates consumed. Interestingly, the study found that the whole grain group had a calorie deficit (burned off more than they took in) more each day due to a few different factors, including an increased resting metabolic rate. Moreover, the authors postulated that this calorie loss could “translate into a ~2.5-kg (5.5 lbs.) body weight loss over one year.”

The other complementary study by Vanegas, et al., analyzed different endpoints and samples from the Karl et al., study to investigate the impact of whole grains on the microbiome. The microbiome is a complex community of microorganisms such as bacteria, fungi, and viruses found on and in our bodies. While we are only at the early stages of understanding the impact of the microbiome, current research indicates that these communities provide us with important health functions.

One of the largest microbial communities resides in our gastrointestinal (GI) tracts. Data from Vanegas et al., demonstrate that short-term whole grain consumption altered the GI microbiome composition and modified specific immune system and inflammatory markers. However, the researchers acknowledged that these effects were “modest” and that additional follow-up studies are “needed to observe more dramatic effects on immune and inflammatory responses.”

How does this impact what we already know?

So how do these findings stack up with the body of evidence? These findings feed in nicely to the current recommendations regarding carbohydrates and whole grains, which is to make half of your grain intake whole grains. In fact, comprehensive evidence from the Nutrition Evidence Library indicates that there is moderate evidence linking whole grain intake and lower body weight. If you are looking to boost your whole grain intake and meet the daily recommended 48 grams, try to incorporate more whole wheat flour, oats, cornmeal, popcorn, brown rice, bulgur, barley, rye, and quinoa into your diet.

However, this does not mean that there isn’t a place for other grains, such as enriched refined grains. Enriched refined grains contribute a variety of essential micronutrients such as B vitamins, thiamin, riboflavin, niacin, and folic acid, as well as iron. These micronutrients are key for supporting your overall metabolism and some specific micronutrients, such as folic acid, decrease the risk of neural tube development during pregnancy.

While these two studies on whole grains reveal a compelling reason to make half your grains whole, don’t forget about their other half. Both whole and enriched refined grains contribute important nutrients and are key components of a healthy eating pattern.

thumbnail

By Stephanie Bryant-Erdmann, USW Market Analyst

The common refrain right now is “the world is awash with wheat.” While that is true in the aggregate, in terms of milling wheat and, more specifically, high-protein milling wheat, supply is very tight. The impact of the small supply of high-protein milling wheat can be seen in the protein premiums for both U.S. hard red spring (HRS) and hard red winter (HRW) wheat. The following is a breakdown of pricing and availability of the U.S. high-protein wheat supply by class and port of export. Please note that U.S. wheat protein is expressed on a 12 percent moisture basis, not on a dry matter basis, thus U.S. 11.5 percent protein is equal to 13.1 percent protein on a dry matter basis.

Hard Red Winter

According to USDA, HRW production fell 32 percent from 2016/17 to 20.4 million metric tons (MMT), putting total HRW supply at 36.5 MMT. According to USW Crop Quality data, the average protein of this year’s HRW crop is 11.4 percent. That is similar to last year, but below the 5-year average. Overall, 55 percent of HRW samples were less than 11.5 percent protein; 26 percent had 11.5 to 12.5 percent protein and 19 percent had protein levels above 12.5 percent. Extrapolating that to HRW production, there is roughly:

  • 9 MMT of HRW with protein greater than 12.5 percent;
  • 3 MMT with protein between 11.5 and 12.5 percent; and
  • 2 MMT with less than 11.5 percent protein available.

The smaller crop and lower protein support both the Kansas City Board of Trade HRW futures market and protein premiums; however, that support varies by export tributary.

Gulf. The 2017/18 marketing year (beginning June 1) average protein premium for Gulf HRW 12.0 percent protein on a 12 percent moisture basis (mb) is 51 percent above the 2016/17 marketing average at $69 per metric ton (MT) and $20 dollars per MT above the 5-year average. The HRW Gulf export tributary region experienced its second consecutive year of higher yields and very limited heat stress during the growing season, resulting in lower than normal protein. According to USW Crop Quality data, the average protein for Gulf export tributary HRW is 11.2 percent, compared to the 5-year average of 12.8 percent protein. This means that while protein premiums for high-protein HRW are climbing, ordinary HRW from the Gulf represents a significant bargain for customers with export basis levels 31 percent below the 5-year average at $28/MT.

Pacific Northwest (PNW). Unlike the Gulf export tributary states, HRW in the PNW tributary states was stressed by high temperatures and little rainfall in 2017/18, boosting protein content but cutting yields. According to USW Crop Quality data, the average protein for PNW export tributary HRW is 12.0 percent, similar to the five-year average but higher than the average of 11.7 percent protein in 2016/17. USDA estimates the PNW HRW tributary states sampled by USW produced 3.5 MMT, or just 17 percent of the total U.S. HRW supply. With the PNW supply limited, albeit a supply with higher protein than the Gulf, the average price for 12.0 percent protein HRW is 9 percent higher than the 2016/17 value at $238/MT, but still well below the 5-year average of $277/MT. This represents an excellent opportunity for customers to lock in prices before supplies dwindle in the second half of the marketing year.

Hard Red Spring

According to USDA, HRS production fell 22 percent to 10.5 MMT in 2017/18. Total HRS supply declined 18 percent from 2016/17 to 20.8 MMT on smaller production and beginning stocks. According to USW Crop Quality data, the average protein of this year’s HRS crop is 14.6 percent. That is above both last year and the 5-year average of 14.0 percent. Overall, 22 percent of HRS samples tested had less than 13.5 percent protein; 23 percent of samples had 13.5 to 14.5 percent protein and 55 percent of samples had greater than 14.5 percent protein. If that is extrapolated out to HRS production, then roughly:

  • 8 MMT of HRS was produced with protein greater than 14.5 percent;
  • 4 MMT having protein between 13.5 and 14.5 percent; and
  • 3 MMT with less than 11.5 percent protein available.

This distribution caused protein premiums for HRS to fall below the 5-year average, but supported HRS MGEX futures, which spiked in July and remain an average $49/MT above last year’s futures prices due to the smaller supply. Like HRW, price impacts of the smaller supply vary by export tributary region but were more evenly distributed due to a nearly even production split between regions.

Eastern Region. The average cash price for Gulf HRS 14.0 percent protein is 16 percent above the 2016/17 marketing average at $298/MT. The higher price is supported by the extreme drought across the U.S. Northern Plains which cut production but boosted protein content. USW Crop Quality data showed the average protein for Gulf export tributary HRS was 14.4 percent, compared to the 5-year average of 14.0 percent protein.

Western Region. The drought had devastating effects on yields in the Western Region, specifically in Montana and western North Dakota and South Dakota, but did boost protein levels. According to USW Crop Quality data, the average protein for the PNW export tributary is 14.9 percent, compared to the 5-year average of 14.2 percent protein. With the increased availability of high-protein HRS, the average protein premium for 14.0 protein HRS fell 10 percent year over year to $53/MT, well below the 5-year average of $67/MT.

With Canadian wheat production falling an estimated 5.5 MMT year over year and the sharp drop in U.S. high-protein wheat production, the global supply of high-protein wheat has tightened. Depending on what protein specifications customers need, this may be the best time to lock in lower HRS protein premiums. Low-protein HRW also represents an excellent buying opportunity for specific customers.

thumbnail

Original article published on Oct. 12, 2017 by the American Farm Bureau Federation in collaboration with U.S. Wheat Associates.

Before the North American Free Trade Agreement (NAFTA) entered into force on Jan. 1, 1994, state intervention and import tariffs held back U.S. wheat exports from the Mexican market. NAFTA ended both, and the newly opened market helped the Mexican flour milling and wheat foods industries to flourish, along with U.S. wheat imports (see chart).

USW represents the interests of U.S. wheat farmers in international markets. As it does with all U.S. wheat importing customers, USW focuses on helping Mexico’s sophisticated buyers, millers and food processors solve problems or increase their business opportunities utilizing specific U.S. wheat classes as ingredients in specific types of wheat foods. This effort, supported by wheat farmers and the partnership with the Market Access Program (MAP) and Foreign Market Development (FMD) program, has fostered a productive relationship that has endured for decades through many challenges.

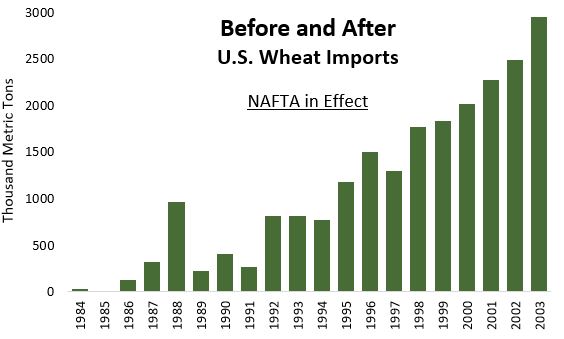
Source: USDA Foreign Agricultural Service, Official USDA Estimates.

Mexico Leads All U.S. Wheat Importers

Today, Mexico is one of the largest U.S. wheat buyers in the world, importing just under 3.0 MMT on average going back many years. Mexico’s U.S. wheat imports typically only fall just short of the volume Japan imports. Not in marketing year 2016/17 (June to May), however, when Mexico’s flour millers imported more than 3.3 MMT of U.S. wheat, which is more than any other country. That volume is up 39 percent over marketing year 2015/16.

Breaking down their purchases by class, flour millers in Mexico generate strong demand for U.S. HRW wheat. The association representing Mexican flour millers says a rising number of industrial bakeries, along with traditional artisanal bakeries, account for about 70 percent of the country’s wheat consumption. That puts HRW producers in a good position to meet that demand. In 2015/16, Mexico was the leading HRW importer and buyers took advantage of favorable prices and the high quality of the 2016/17 HRW crop to import 2.0 MMT. That is 79 percent more HRW imports compared to 2015/16 and again led buyers of that class. Being closer to HRW production and having a highly functioning ability to import a large share of HRW directly via rail from the Plains states — duty free under NAFTA — is an advantage for Mexico’s buyers.

In addition, Mexico is home to Bimbo, the world’s largest baked goods company, and an increasing number of other cookie and cracker companies. The functional properties of U.S. soft red winter wheat (SRW) is well suited to the production of cookies, crackers and pastries, and serves as an excellent blending wheat. Millers supplying this growing market imported an average of 1.2 MMT of SRW between 2011/12 and 2015/16. With imports from the Gulf of more than 1.0 MMT of SRW in 2016/17, Mexico was the year’s top buyer of SRW again. USW and state wheat commissions from the PNW are also helping demonstrate how millers and bakers can reduce input costs by using U.S. SW as a blending wheat for specialty flour products.

The successful story of how U.S. wheat farmers and their customers in Mexico have worked together in a mutually beneficial way under NAFTA and, for now, U.S. wheat continues to flow to our customers in Mexico. Total exports sales to Mexico returned more than $633 million to wheat farmers across the Plains and east of the Mississippi River in 2016/17.

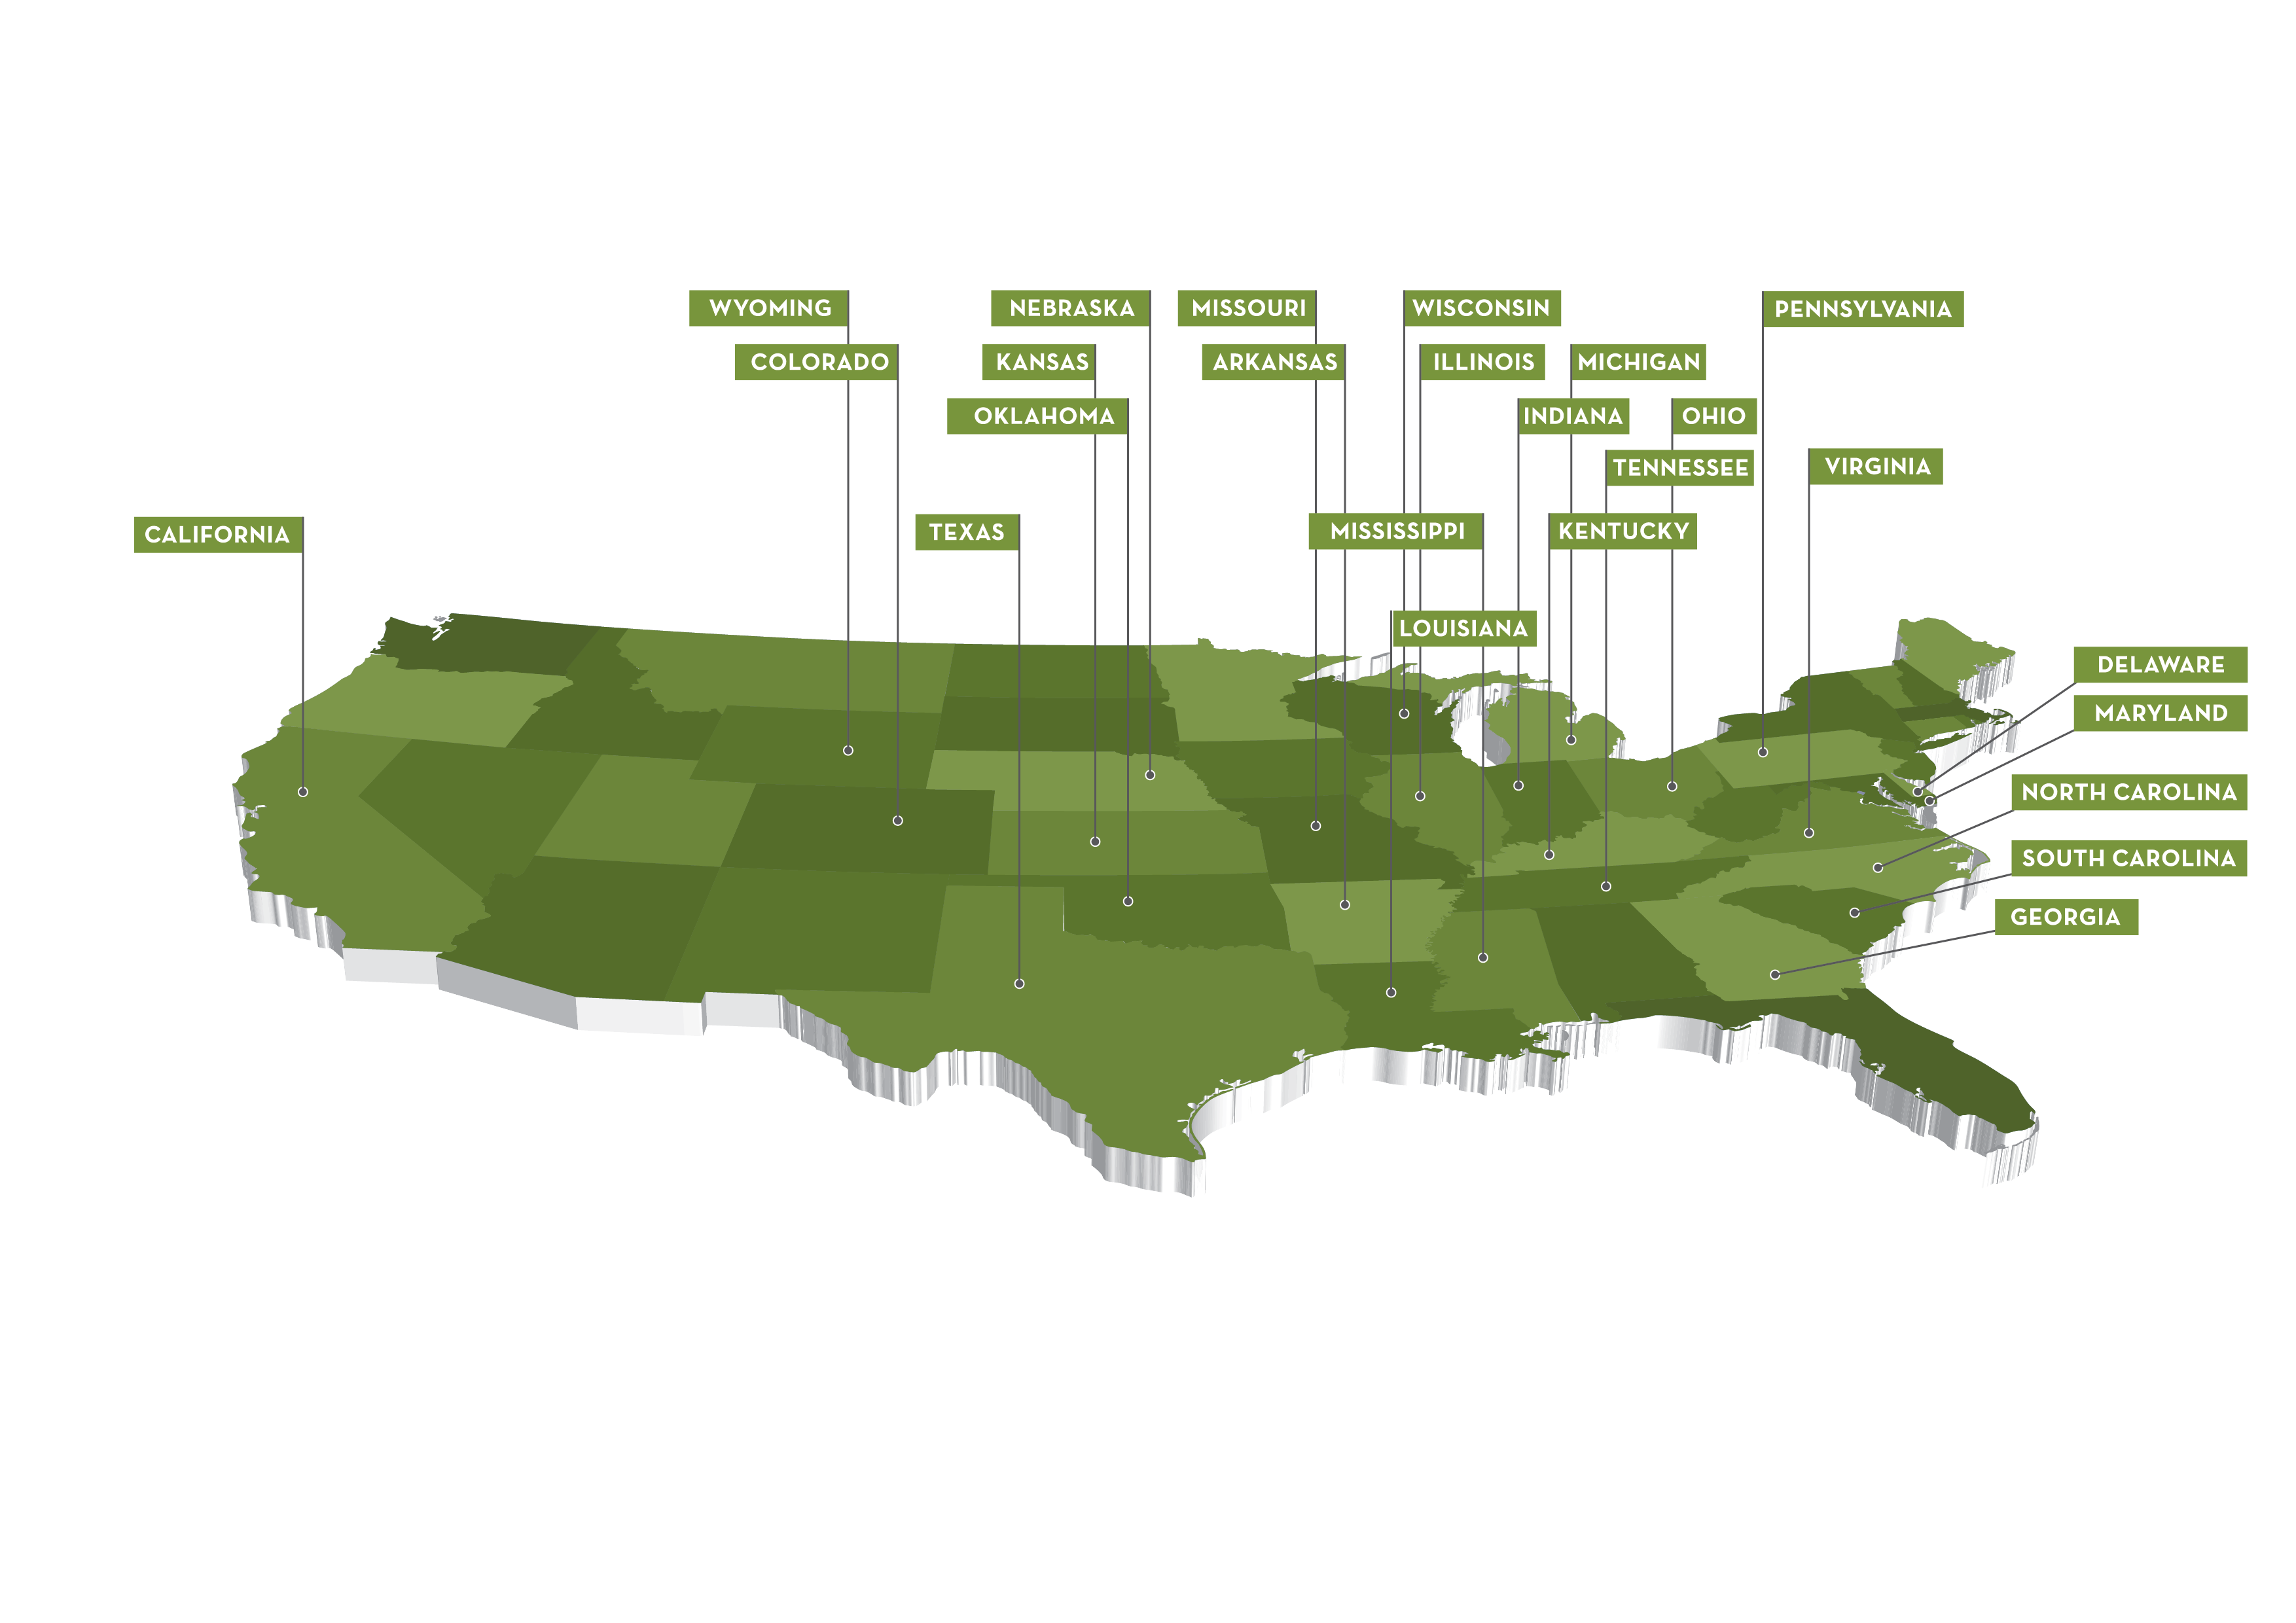
The data for this map is based on Mexico’s market ranking for primary class of wheat grown in that state in the 2015/16 marketing year. Most wheat states’ farmers rely on Mexico as their number one market.

Source: Small Grains Summary and Export Sales, USDA

Increasing Competition

With U.S. wheat farmers facing financial hurdles, open access to the Mexican market is needed now more than ever. A prosperous Mexico is crucial for U.S. wheat farmers. But these savvy Mexican milling and baking sector customers have shown they can also adapt to other wheat supplies.

After a price shock in 2007/08, Mexico lifted its non-NAFTA wheat import tariff and wheat from other origins began to trickle in. From the first single boat carrying French wheat in 2010/11, non-NAFTA imports became a quarter of all Mexico’s wheat imports by 2015/16. The cost of U.S. wheat has a freight advantage over competitors, but if Mexico encourages purchasing from other origins or a new NAFTA agreement results in impediments to U.S. wheat imports, it has plenty of supply alternatives that are ultimately harmful to U.S. wheat growers.

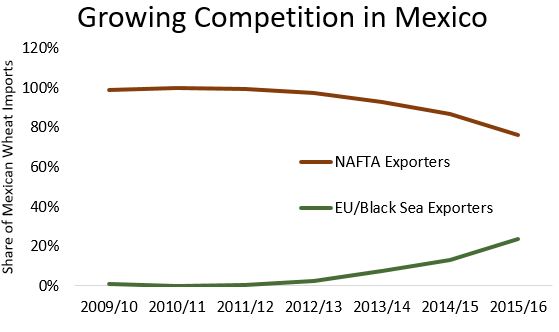
Source: Global Trade Atlas

New Negotiations Can Build on NAFTA’s Success

Wheat trade with Mexico under NAFTA is already open and fair, but improvements to the agreement are possible. The three NAFTA parties agreed to some improvements as part of the Trans-Pacific Partnership (TPP) agreement that could be incorporated into a NAFTA update. TPP would have updated rules on sanitary and phytosanitary (SPS) measures, which have created major trade problems in some markets. U.S.-initiated trade restrictions often backfire on U.S. agricultural exports, so the wheat industry supports maintaining open markets for all parties.

Renegotiations could also enable full reciprocity for cross-border wheat trade with Canada. Canada allows tariff-free access to wheat from the United States and certain other foreign sources. However, a Canadian law requires that imported wheat, even wheat of the highest quality, must be segregated from most Canadian wheat. It is automatically given the lowest grade established by regulation and therefore receives the lowest possible price.

By contrast, Canadian producers are free to market their wheat in the United States through normal marketing channels. When graded at a U.S. elevator, Canadian wheat is treated the same as U.S.-origin wheat and is assigned a grade based on objective quality criteria, meaning that unlike U.S. wheat going north, it retains its value when it crosses the border.

“U.S. farmers should be able to deliver their wheat to a Canadian elevator and not automatically receive the lowest grade because it was grown on our side of the border,” said Ben Conner, USW Director of Policy. “This concept is needed for U.S. wheat farmers who live near the Canadian border, is supported by the Western Canadian Wheat Growers Association, and is already Canada’s legal obligation under existing trade agreements.”

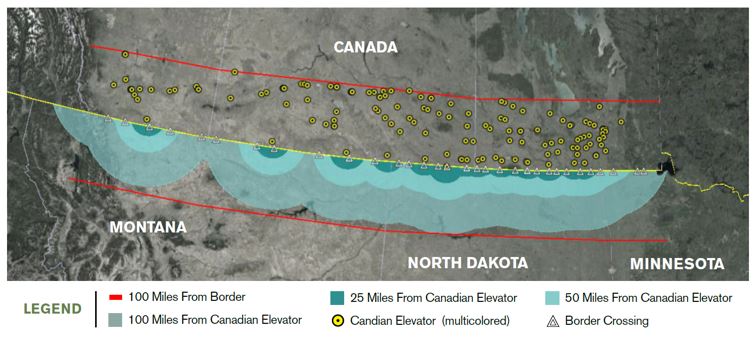
The map above illustrates U.S. land that would be most affected by an open border with Canada for wheat via truck. The blue rings represent land south of the border that is within 25, 50 and 100 miles away from a Canadian elevator.

Do No Harm, Please

The U.S. wheat industry welcomes the opportunity for improving the framework for cross border wheat trade between the United States, Canada and Mexico, but would strongly oppose changes that might limit the current NAFTA’s benefits for wheat farmers and their customers, particularly in the Mexican food processing industries.

“I cannot emphasize enough how important our Mexican customers are to U.S. wheat farmers,” said Jason Scott, a wheat farmer from Easton, Md., and USW Past Chairman. “There is nothing wrong with modernizing a 23-year-old agreement, but that must be done in a way that benefits the food and agriculture sectors in both countries.”

thumbnail

Each year, USW sponsors overseas customers to travel to the United States as members of a trade delegation or to attend a short course, with more than 100 customers participating each year.

In 2017, USW sponsored a total of 72 participants from Latin America, Africa, Asia and Europe to attend seven short courses and four workshops at the Northern Crops Institute, the IGP Institute and Wheat Marketing Center, and for the first time, at the USDA Agricultural Research Laboratory in Wooster, Ohio.

The courses provided by these institutions are instrumental in providing customers with the information needed for making future purchases by covering a range of topics to educate them on the value of U.S. wheat classes and providing exposure to the U.S. grain marketing system, the flow of grain from farm to port and the U.S. inspection system, to name a few. Through targeting bakers, millers and end-product manufacturers, USW and our partners showcase the quality of products that can be made using wheat from the United States.

Trade delegations are another way for customers to learn about U.S. wheat. This year, USW hosted a total of 12 trade delegations composed of 63 customers and 14 staff. Customers from Japan, Algeria, Morocco, Taiwan, Chile, Nigeria, South Africa, Korea, Philippines, Vietnam and Singapore visited 11 states (California, Idaho, Kansas, Minnesota, Montana, Nebraska, North Dakota, Oklahoma, Oregon and Washington), as well as Washington D.C., and USW’s Headquarters in Arlington, Va.

Visiting wheat-producing states allows customers to directly connect with farmers, state wheat commissions and industry partners, while learning about the U.S. wheat marketing structure and transportation logistics.

Whether it is through short courses or trade delegations, the goal is the same for USW and partners: to promote the reliability, quality and value of all six U.S. wheat classes to customers around the world. Our success relies on the success of our customers and their ability to create products that appeal to consumers in markets around the globe.

thumbnail

By Stephanie Bryant-Erdmann, USW Market Analyst

USDA expects a lower world wheat production in 2017/18 of 751 million metric tons (MMT) (27.6 billion bushels), down slightly from the record high 754 MMT (27.7 billion bushels) in 2016/17 but 5 percent above the 5-year average. If realized, it would be the first production decline since 2012/13. While world wheat production is projected to decline year over year, USDA expects slightly higher total consumption in 2017/18 at 740 MMT (27.2 billion bushels), compared to the 5-year average of 705 MMT (25.9 billion bushels). With production expected to decline and consumption forecast to rise, availability of global wheat supplies is largely dependent on location and whether or not that country is an importer, exporter or China.

Record-large world carry-in stocks offset the production decline with total world supply reaching a projected 1007 MMT (37.0 billion bushels), up 12.4 MMT from 2016/17. However, removing China’s 2017/18 projected beginning stocks and production from global wheat supply reveals roughly a 3 MMT decline in global supplies. While small, the decline in global wheat supplies is compounded by a shift in location, which has implied impacts on availability, quality and, of course, price.

Exporting countries. USDA forecasts supplies in the top wheat exporting countries of Argentina, Australia, Canada, the European Union (EU), Kazakhstan, Russia, Ukraine and the United States to decrease by 2 percent or roughly 10 MMT year over year to 460 MMT. A 9 MMT year over year increase in exporter beginning stocks partially offsets the anticipated 5 percent decrease in production. However, a 19 percent increase in Russian wheat supplies due to sharply higher 2017/18 production is partially masking forecasted declines in five of the major eight exporters — Argentina, Australia, Canada, Ukraine and the United States. Wheat supplies in the EU are expected to remain stable year over year at 161 MMT, and Kazakhstan wheat supply is expected to increase 2 percent from 2016/17 due to higher beginning stocks.

Russian wheat supplies total 20 percent of exporting country supplies, making the quality of the crop very important. SGS Russia, an independent crop inspection service, reported preliminary data for winter wheat in south, central and the Volga-Urals regions of Russia showed lower protein levels due to favorable growing conditions which boosted yields. According to the SGS data, 22 percent of samples graded as Russian 3rd class wheat (10.5 to 11.9 percent protein on a 12 percent moisture basis (mb)); 46 percent of the samples graded as Russian 4th class wheat (8.8 to 10.5 percent protein on a 12 percent mb); and 32 percent as 5th class wheat (feed wheat). SGS reports that some areas have Fusarium damage, high levels of sprout damage and very low falling numbers; but test weight values are generally higher across all regions.

Importing countries. Importing country beginning stocks are forecast to be 10 percent lower year over at 72.4 MMT, due to customers utilizing “just in time” purchasing strategy to take advantage of low global wheat prices. Production in the importing countries is expected to increase 7 percent year over year, lifted by a 11.4 MMT increase in India after two poor crops there. Total importing country supplies are expected to increase 2 percent to 307 MMT due to the lower beginning stocks falling and increased production. However, it should be noted that 108 MMT, roughly 35 percent, of that supply will remain in India.

China. USDA expects Chinese beginning stocks to climb to 111 MMT, up 14 percent over 2016/17. If realized, China will hold 43 percent of 2017/18 total global wheat beginning stocks. Chinese wheat production is also expected to rise in 2017/18 to 130 MMT, up 1.15 MMT from 2016/17. This puts total 2017/18 Chinese wheat supplies at 241 MMT, 7 percent greater than 2016/17. Yet Chinese wheat consumption is expected to decline 2 percent to 116 MMT due to an anticipated decrease in wheat feed usage. With supply up and consumption down, 2017/18 Chinese ending stocks are expected to grow to 127 MMT, up 14 percent from last year and a new record. If realized, Chinese ending stocks would account for 47 percent of all global wheat ending stocks for 2017/18.

While supplies in most importing countries are shrinking (India being the notable exception), global human consumption of wheat continues to grow. USDA expects global human wheat consumption to increase 2 percent in 2017/18, led by increases in regions that depend on imports for the entirety of their supply, including Southeast Asia, Central America and the Caribbean. With 81 percent of global wheat consumption going to humans, understanding the quality and availability of the 2017/18 crop is important.

The 2017/18 USW Crop Quality report will be available online on Monday, Oct. 23. Contact your local USW representative for more information about the 2017/18 U.S. wheat quality, production and logistics.

Harvest Report

USW and its partner organizations have completed the crop quality analysis of the 2017/18 U.S. hard red spring (HRS), soft white (SW) and durum crops. The final data is summarized below. The complete analyses will appear in class-specific reports and USW’s 2017 Crop Quality Booklet, and shared with hundreds of customers around the world as part of USW’s annual Crop Quality Seminars.

Full regional quality reports for the 2017 HRS, SW, northern durum and Desert Durum® crops are posted at www.uswheat.org/cropQuality.

Hard Red Spring. USDA estimates that the total 2017/18 HRS supply (excluding imports) is down 19 percent from 2016/17 due to smaller production and beginning stocks.

Overall, 97 percent of Eastern Region and 83 percent of Western Region samples graded U.S. No. 1. The overall average test weight is 61.6 lb/bu (81 kg/hl), similar to the 5-year average, though the Western Region average is lower due to drought. The average protein is 14.6 percent (12 percent mb), higher than both 2016 and the 5-year average. More than one-half of all samples have greater than 14.5 percent protein in 2017 compared to just 36 percent in 2016.

The smaller 2017 HRS crop has many positive attributes, including high grades, plentiful protein, little to no DON and very good functional performance. Protein levels, shrunken and broken kernels and thousand kernel weights are more variable than recent years due to the vast differences in growing conditions across the region. Diligent contract specifications are still encouraged on this high-quality crop to ensure buyers get the quality expected.

Soft White. USDA estimates total 2017 SW production at 6.14 MMT, down slightly from 2016. Of that, the Washington Grain Commission estimates white club (WC) accounts for 359,000 MT.

The 2017 SW and WC overall average grade is U.S. No. 1. The average SW test weight of 60.9 lb/bu (80.1 kg/hl) is close to last year’s 60.8 lb/bu (80.0 kg/hl), while WC test weight of 60.2 lb/bu (79.2 kg/hl) is slightly less than 2016’s 60.8 lb/bu (80.0 kg/hl). The overall SW and WC wheat protein contents (12 percent mb) of 9.6 percent and 9.4 percent, respectively, are each 0.5 percentage point below the respective 2016 values and well below the wheat protein 5-year averages.

The 2017 PNW soft white wheat crop is generally characterized by having similar kernel characteristics to last year with good test weight, lower moisture content, lower protein content, higher falling number values and acceptable finished product characteristics. This year’s WC quality characteristics follow the same trend as SW. The high protein segment of the SW crop provides opportunities in blends for Asian noodles, steamed breads, flat breads and pan breads.

Durum. Production in the U.S. Northern Plains is down by more than 50 percent from 2016 due to a small decline in acreage and sharply lower yields caused by severe drought. Scattered rain delays toward the end of harvest affected the color of a portion of the crop.

The 2017 Northern durum crop average grade is U.S. No. 1 Hard Amber Durum (HAD). However, a larger portion of the samples than in 2016 graded U.S. No. 1 or 2 Amber Durum due to color loss in some areas. Average test weight of 60.9 lb/bu (79.4 kg/hl) is slightly below last year. Hot, dry conditions pushed protein levels higher, with the 2017 average at 14.5 percent (12 percent moisture basis).

Buyers will be pleased with this year’s excellent grading Northern durum crop boasting strong protein levels, overall high vitreous kernel levels, higher semolina extraction and improved mixing and pasta quality characteristics. With reduced supply and isolated areas with lower vitreous kernel levels, lighter thousand kernel weights and some DON detections, buyers should always remain diligent in their contract specifications.

2017 Desert Durum® production acreage was less than in 2016, largely due to lower prices available at planting time. Yields were average, and quality was uniformly good. The crop exhibits consistently large kernels and low moisture, traits that contribute to efficient transportation costs and high extraction rates. The 2017 crop will deliver the valuable milling, semolina and pasta quality traits that customers have learned to expect and appreciate.

thumbnail

By Stephanie Bryant-Erdmann, USW Market Analyst

Over the past twenty years, roughly 10 MMT of U.S. wheat exports have shifted from price sensitive markets to quality-driven markets. Consumption in quality-driven markets in Southeast Asia and Latin America increased an average 2 percent annually over the past ten years, according to USDA.

In 1995/96, the top ten destinations for U.S. wheat included Egypt, Pakistan and Sri Lanka, whose respective governments purchased large quantities of wheat for subsidized food programs and strategic reserves. Thus, these markets were very price sensitive. While some liberalization has occurred in these markets, subsidized food programs and strategic reserves are still the primary uses for imported wheat by these markets.

Rounding out the top destinations in 1995/96 were markets that value quality: Japan, Mexico, the Philippines, South Korea, Taiwan, Nigeria and the European Union. These markets continue to be top ten destinations for U.S. wheat. Over the past five years, U.S. wheat exports to these seven countries averaged 13.6 MMT compared to 9.78 MMT in 1995/96, an increase of 39 percent, while total consumption increased an average 7 percent over the same time period, indicating increased usage and preference for U.S. wheat despite prices often higher than from other sources.

Since 1995/96, wheat consumption in other quality-driven markets has also grown. Southeast Asian markets, including Indonesia, Thailand, Vietnam and Malaysia1, have grown an average 6 percent annually. U.S. exports to the region increased 93 percent to 2.23 MMT in 2016/17, according to Global Trade Atlas data. Year-to-date, U.S. wheat export sales to the region total 1.23 MMT, on pace with last year’s pace. U.S. wheat exports also increased 59 percent to Latin and South America with 5-year average sales of 6.48 MMT compared to 4.07 MMT in 1995/96.

In 2016/17, the top destinations for U.S. wheat are a veritable who’s who of the markets that value quality, dominated by Asian, Latin and South American markets. In total, the top ten destinations represented 64 percent of U.S. wheat sales during that marketing year. Countries in Central America and South America, including Chile, Guatemala, Honduras, Peru, Venezuela and the Dominican Republic, were in the top 20 destinations for U.S. wheat and accounted for another 9 percent. See the latest USW Commercial Sales report for the resulting increases in wheat exports to the increasingly quality-driven markets in Southeast Asia, Latin and South America.

The goal for any company selling a high-quality product is to make demand for that product inelastic — an increase in price does not have an equal decrease in quantity demanded. Put another way, consumers have such a strong preference for the good that increases in price result in very small decreases in quantity demanded. Creating inelastic demand takes a combination of the right consumers, the right product, hard work, and, in many cases, time.

It is a market development strategy that also provides value to U.S. farmers in the form of higher prices for their wheat compared to farmers in most competing countries. U.S. farmers also continue to work on product quality, investing an average $12 million annually on wheat research through their state checkoff programs, according to a study done by the National Wheat Improvement Committee in 2012. USW has also put more focus and resources into its marketing efforts in markets that are traditionally quality conscious and experiencing growth, such as Japan, Mexico and the Philippines.

1The Philippines is normally included in the Southeast Asia region, but due to the prior reference, its exports sales were excluded from this region’s analysis.