thumbnail

By Stephanie Bryant-Erdmann, USW Market Analyst

With the small, stressed hard red winter (HRW) wheat crop getting the lion’s share of attention, it was an initial surprise to read in USDA’s May World Agricultural Supply and Demand Estimates (WASDE) that U.S. wheat production is expected to increase to 49.6 million metric tons (MMT) in 2018/19. That would be up 5 percent year over year, if realized.

The forecast increase is a result of greater harvested area and slightly higher average yield in the other classes. USDA forecast 2018/19 all wheat average yield at 46.8 bushels per acre (3.15 metric tons [MT] per hectare), up from 46.3 bushels per acre (3.11 MT per hectare) last year. Harvested area is expected to increase 1.3 million acres (526,000 hectares) in 2018/19. Crop condition ratings also matter in this forecast, and as the following by-class reviews show, HRW is clearly the exception to the up-trend in production.

HRW production is expected to be the smallest since 2006/07 at 17.6 MMT. If realized, that would be down 14 percent year over year and 22 percent below the 5-year average. Low farm-gate prices and poor planting weather last fall reduced 2018/19 U.S. HRW planted area to 23.2 million acres (9.4 million hectares), the second lowest planted area on record. That poor start coupled with widespread drought throughout the U.S. Southern Plains set up the current situation where harvested HRW acres are expected to fall 5 percent from 2017/18 to 16.5 million acres (6.68 million hectares).

The large decrease in harvested acres is centralized in the U.S. Southern Plains where HRW crop condition ratings remain poor. In top HRW-producing states of Kansas, Oklahoma and Texas, 51 percent, 65 percent, and 59 percent of HRW is rated poor or very poor, respectively. As a consequence of the drought and resulting poor crop conditions, USDA expects harvested area in Oklahoma to fall 31 percent year over year to 2.0 million acres (810,000 hectares). On May 10, USDA rated 25 percent of HRW in the states surveyed in good to excellent condition, while 45 percent is rated poor or very poor. Read more about the all too evident challenge of wheat farming on the High Plains.

Soft red winter (SRW) production is expected to increase to 8.57 MMT in 2018/19. If realized, that would be up 8 percent year over year, but still 22 percent below the 5-year average. 2018/19 U.S. SRW harvested area is expected to increase 8 percent from the year prior to 4.0 million acres (1.62 million hectares). USDA also expects record high yields in Indiana, Kentucky, Maryland and Michigan due to favorable growing conditions this spring.

On May 14, USDA noted week over week crop condition rating improvements in nearly all SRW-growing states, with 67 percent of the SRW acres surveyed rated good to excellent. Week over week improvements were noted in Illinois and Arkansas where 63 percent of SRW was rated good to excellent, up 10 percentage points and 5 percentage points, respectively, from the week prior.

White wheat.* 2018/19 white winter wheat production is forecast at 6.24 MMT, including 5.66 MMT of soft white (SW) winter wheat and 577,000 MT of hard white (HW) winter wheat. If realized, SW winter wheat production would be up 2 percent year over year, due to increased planted area, while HW winter wheat production would be down 11 percent from 2017/18 due to forecast reduction in average yield. SW winter wheat production is centralized in the Pacific Northwest (PNW) states of Idaho, Oregon and Washington. As of May 14, 71 percent of Idaho SW, 80 percent of Oregon SW and 85 percent of Washington SW was rated in good to excellent condition.

Desert Durum®. USDA expects Desert Durum® production — centralized in Arizona and California and planted in the winter — to total 332,000 MT, up 6 percent from 2017/18 due to significantly better yields in California. In Arizona, the Desert Durum® crop was 90 percent headed by April 29, significantly ahead of the year prior’s pace.

Spring wheat and Northern durum. Snow covered, frozen fields delayed spring wheat and Northern durum planting this year, but U.S. farmers are beginning to catch up. As of May 14, spring wheat and durum planting is 58 percent complete, up from just 30 percent complete the week prior, but still behind the 5-year average pace of 67 percent.

With spring planting still underway, USDA did not provide a by-class breakdown of production for hard red spring (HRS) and durum on May 10. However, USDA did note that combined spring wheat and Northern durum production is projected to increase 34 percent year over year due to “both increased area and yield.” With total U.S. wheat production projected at 49.6 MMT and U.S. winter wheat production projected at 32.4 MMT, that puts 2018/19 spring wheat — including soft white spring, HRS, and hard white spring — and durum production at 17.2 MMT.

Back on March 29, USDA projected U.S. HRS planted area at 12.1 million acres (4.9 million hectares). If farmers are able to realize their planting intentions despite the late start, that would be up 17 percent year over year. Northern durum planted area was forecast at 1.88 million acres (760,000 hectares), down 14 percent, if realized. Still, weather will play a role in farmers’ decisions, and a late spring in Montana and western North Dakota tends to favor increased wheat area. Conversely, it tends to favor increased corn and soybean acres in Minnesota.

To stay in touch with U.S. wheat harvest progress, subscribe to the U.S. Wheat Associates Weekly Harvest Reports, which will start later this month.

*In the May 10 report, USDA combined data for soft white winter wheat and hard white winter wheat. Both soft white (SW) and hard white (HW) can be grown in either the spring or fall. USDA will provide a wheat by-class outlook in July. Similarly, data for HRS, SW spring, HW spring and spring-planted durum were combined into a general “spring-planted wheat” category.

thumbnail

By Stephanie Bryant-Erdmann, USW Market Analyst

On May 10, USDA forecast the 2018/19 global wheat supply to hit a record 1,018 million metric tons (MMT) despite the expectation that global wheat production will fall for the first time in 5 years to 748 MMT.

At the same time that global wheat production is expected to decrease, global wheat consumption is expected to reach a new record of 754 MMT, 5 percent above the 5-year average.

The reason global wheat supplies continue to grow is because of an anticipated 6 percent year over year increase in beginning stocks — 47 percent of which are in China. This large percentage of global wheat stocks residing in China’s wheat stocks are masking an otherwise declining global wheat supply.

By the end of 2018/19, USDA expects Chinese ending stocks to total 139 MMT, 52 percent of global wheat ending stocks.

Because China’s endings stocks are masking the declining global wheat supply, the traditional stocks-to-use ratio is 35 percent.

However, when Chinese stocks and use are removed from the ratio, the 2018/19 global stocks-to-use ratio falls sharply to 20 percent, the tightest stocks-to-use ratio since 2007/08.

Buyers should continue to monitor conditions around the world and recognize that global wheat supplies are much tighter than traditional global supply and demand estimates show.

View the U.S. Wheat Associates full 2018 May World Wheat Supply and Demand Situation Graphic Summary.

thumbnail

By Steve Mercer, USW Vice President of Communications

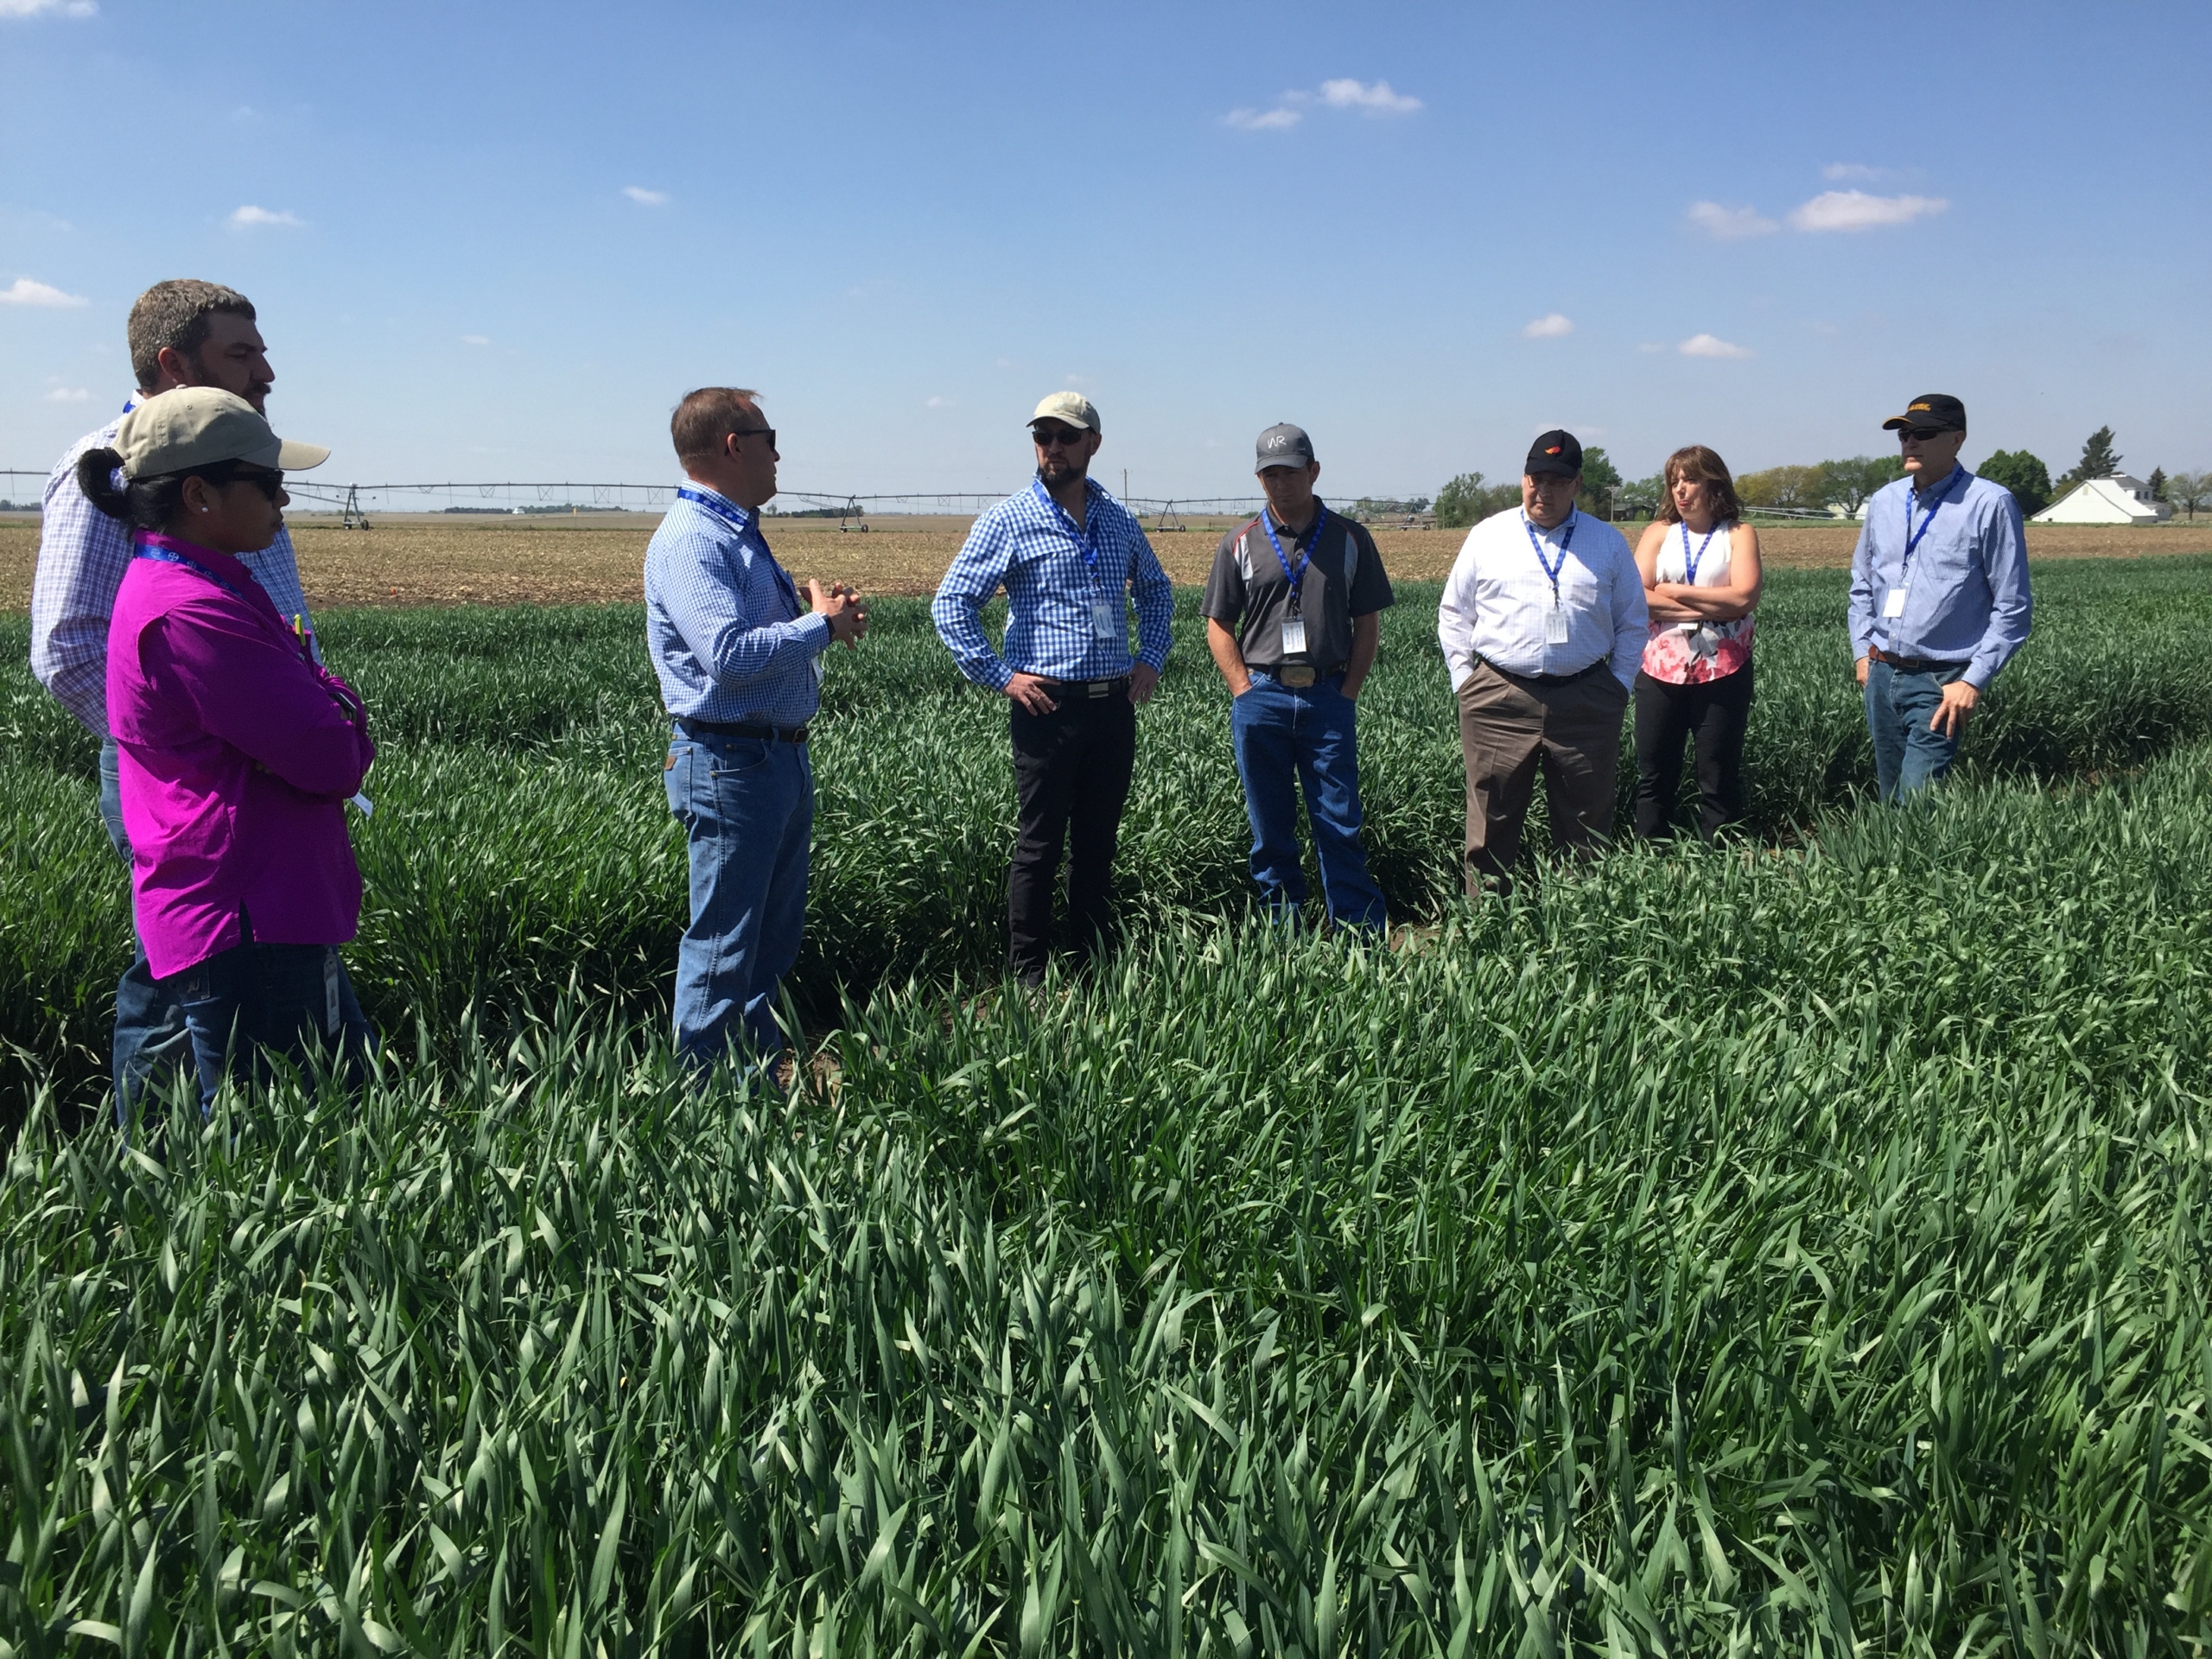
Several colleagues from U.S. Wheat Associates (USW) had a great experience on May 16 on a visit to Bayer Corporation’s main North American wheat breeding laboratory and nursery near Lincoln, Neb. They had a true look at the future, one that includes a more stable supply of high quality wheat for millers and wheat food processors around the world.

Bayer has made a substantial commitment to overcoming an age-old wheat breeding challenge: to develop and commercialize hybrid wheat.

The process of producing hybrid plant seeds can be simply described. Two distinct varieties of the same plant, each with unique characteristics are cross-bred. One plant has sterile female flowers, the other produces pollen and the fertilized plant produces a new, unique offspring.

But with a complex plant like wheat with three whole genomes in each cell and often 6 copies of each gene, that process is not easy. In fact, it was described as downright complex. Some of the scientists USW met with have worked toward hybrid wheat for more than 10 years. They say the work requires collaboration with a wide range of scientific disciplines; a true team effort. And the team at Bayer certainly represent that. They are focused on the hybrid goal, their comradery is quite evident and they are very excited about the potential of the work. The team includes experienced winter and spring wheat breeders, as well as plant pathologists who are testing new varieties for resistance to diseases like Fusarium head blight, or scab. Perhaps most important for the world’s U.S. wheat buyers, this team includes wheat quality specialists who are determining if new hybrid varieties meet or exceed grade and functional milling, baking and processing standards for the wheat class. If a new line does not meet or exceed standards, it is rejected.

Bayer and other public and private breeders are working toward hybrid lines for several reasons. Hybrid wheat demonstrates a productive yield increase. This is needed by farmers, especially small holder farmers, around the world to offset the currently limited profitability of growing single line wheat varieties. It is also needed to continue meeting record setting use of wheat by a growing global population. They see much more stable production levels across a variety of growing conditions with hybrid wheat. Hybridization also allows breeders to “stack” native and non-GM traits into wheat seed more precisely and efficiently than other breeding methods.

There is much work to be done, especially to screen and refine the new lines being produced, and it will be many years before hybrid wheat seeds are fully ready for farmers’ fields. However, the USW colleagues saw why the Bayer team is so enthusiastic about their work in the field trial plots around the Nebraska facility. What was described as a “radical transformation” of the tools available to conduct this complex research is accelerating the ability to bring new wheat lines to market. Most encouraging was the company’s willingness to incorporate into their work USW’s knowledge of what overseas millers, bakers and wheat food processors need to improve the quality of and demand for their end products.

USW wants to thank not only the Bayer team for their transparency and interest in our work with the world’s wheat buyers and users, but also wheat breeders around the world, who are working day and night to improve this staple crop for an increasingly hungry world.

thumbnail

In an ominous, smoke-filled room, the black wings of a hundred crows scatter to the rafters at the sound of a fist pounding at the head of an ancient table. A menacing voice demands to know how the poor soul cowering at the other end has failed to submit notifications on Current Total Aggregate Measurement of Support for over a decade. Utter silence pervades the room except for the subdued voice of a distant translator speaking into a headset. The cowering soul, finally comprehending the question, hurriedly vows that notifications will cover the table before the rooster awakens the dawn.

If only.

Notifications play a vital role in the workings of the World Trade Organization (WTO). The WTO is supposed to be much more than a court for litigation; it is also a forum for negotiation and monitoring how its members comply with the rules to which they agreed. Notifications feed information into the system on a variety of topics, from quota administration to trade-related phytosanitary measures to agricultural domestic support, among many others. Centralizing this information along with active discussions between officials helps facilitate negotiations and sheds light on problems in the marketplace.

In reality, many countries do not submit notifications or delay for so long that they are practically worthless by the time other countries can review them. Fully one-third of WTO members had outstanding notifications on agriculture that were at least two years overdue in 2017, and some much older than that. For example, Turkey – a major wheat producer – submitted domestic support (or subsidy) notifications in July 2017 covering the three years from 2002 to 2004.

The notification system works well enough when countries are abiding by their WTO commitments and are reasonably committed to the system, but it has become clear that many countries need some extra motivation, particularly those that are sources of major distortions in agricultural markets. That is why we are glad that the United States government has taken steps to highlight this issue through a transparency proposal it made in advance of the latest World Trade Organization ministerial meeting in Buenos Aires.

The U.S. proposal would provide for a proportionate response to failures by countries to fulfill basic WTO transparency and notification requirements. After a certain period when a country is delinquent in its notifications and uncooperative in providing information, it will lose basic privileges and access to WTO materials and activities. If it remains delinquent for no more than three years beyond a notification deadline, the WTO will designate the country as an “Inactive Member” of the WTO until its notifications are current.

This approach seems reasonable and logical – if a country is failing to meet basic obligations, it should lose benefits of membership. Today there are no consequences for noncompliance with transparency commitments except the consternation of frustrated colleagues.

Maybe it’s time to give that soul a reason to cower.

By Ben Conner, USW Vice President of Policy

thumbnail

By Stephanie Bryant-Erdmann, USW Market Analyst

This week I joined the annual Wheat Quality Council (WQC) Hard Red Wheat (HRW) Tour for an early survey of the new crop. Each year, participants gather in Manhattan, Kan., and spend the next two and a half days in small scout teams, randomly stopping at 14 or more fields in a full day along the same routes followed for many years. The teams measure yield potential, determine an average for the route and estimate a cumulative average for the day when all the scouts come together in the evening. Last year, tour participants faced snow and muddy fields. This year, the snow is a distant memory, as fields on days one and two were all bone dry. A violent storm rolled through central Kansas on Day 2, which cut some scouting short, but brought much needed moisture to the wheat fields.

Just a few hours before U.S. Wheat Associates (USW) published this issue of “Wheat Letter,” the tour estimated a final average yield potential of 37.0 bushels per acre (bu/ac) or about 2.49 metric tons (MT) per hectare for the 2018/19 Kansas HRW crop. This year, the tour participants made 644 stops to scout fields. Combining seeded area with per-acre yield potential, the total production potential estimate was 243.0 million bushels [(6.61 million metric tons (MMT)]. Last year’s total production estimate was 282 million bushels (7.67 MMT).

On the first day, the tour traveled from Manhattan along several routes covering most northern Kansas counties. The cumulative Day 1 average yield potential was 38.2 bu/ac, which is equivalent to about 2.57 MT per hectare, compared to 43.0 bu/ac (2.89 MT per hectare) in 2017. To reach that average, participants surveyed a record 317 fields recording a range from a low of 17 bu/ac to a high of 93 bu/ac. We saw very short wheat that was two to four weeks behind developmentally. Fields were very dry, which has prevented disease establishment, but threatens yield potential.

Participants also received a report on the Nebraska and Colorado wheat crops. Nebraska estimated an average 43.0 bu/ac (2.89 MT per hectare) for a total production estimate of 43.7 million bushels (1.19 MMT), down roughly 7 percent from last year’s tour estimate. Colorado estimated an average of 35.0 bu/ac (2.35 MT per hectare) with total production estimated at 70 million bushels (1.90 MMT), down 19 percent year-over-year, if realized.

On the second day, the tour traveled on routes that led from the city of Colby to Wichita, making 284 stops. The number of observations was up significantly from last year due to much better field conditions this year, though severe weather including tornados and hail, did cut some scouting short. Scouts reported most wheat was one to two weeks behind normal development, but continued to see very little disease pressure. This year, the tour estimated Day 2 average yield at 35.2 bu/ac (2.37 MT per hectare), for a combined two-day average of 36.8 bu/ac (2.47 MT per hectare) across 601 stops. Last year, the combined two-day average was 44.9 bu/ac (3.02 MT per hectare) on 427 stops.

Participants also received a crop report from Oklahoma, where drought conditions severely impacted the panhandle of the state which received less than 0.1 inch (less than 0.5 cm) of rain between September and mid-February. The estimated average yield in Oklahoma is 24.8 bu/ac (1.67 MT per hectare), for a total production estimate of 54.8 million bushels or about 1.49 MMT. If realized, that would be down 44 percent year over year. With decreased yield potential, many farmers have chosen to graze out the wheat fields to feed hungry cattle whose pasture has been impacted by the drought as well. As a consequence, harvested area in Oklahoma is expected to be sharply lower in 2018/19.

The third and final day of the tour was shorter, with each car making three to four field stops on the way from Wichita to Manhattan for the final report. The Day 3 estimated average yield was 39.8 bu/ac, (2.67 MT per hectare) across 43 stops.

View highlights and photos from the tour by searching #wheattour18 on Facebook and Twitter. The WQC also sponsors a spring wheat tour in the Northern Plains in July. For more information, visit the Council’s web site at https://www.wheatqualitycouncil.org.

thumbnail

By Jonathan H. Harsch, Agri-Pulse, Excerpted with Permission

(Editor’s note: This is the third in a new series of Agri-Pulse in-depth stories dealing with the challenges and opportunities for U.S. agriculture when it comes to selling more commodities and value-added products to overseas customers. This article was sponsored by funding from the National Association of Wheat Growers, U.S. Wheat Associates, Washington Grain Commission, North Dakota Wheat Commission and Idaho Wheat Commission.)

Prospects for U.S. farm exports can change suddenly and dramatically.

Breaking into foreign markets takes decades of persistent hard work and hefty investments in building infrastructure, relationships and, ultimately, sales.

Augusto Bassanini, chief operating officer for United Grain Corp., knows firsthand the challenges of building all three. This experienced grain exporter tells Agri-Pulse that after taking years to build trust and a reputation for reliability, “any interference with that trust, that reliability, is going to have an immediate impact … So, you spend years building that rapport and everything could change overnight.”

“It takes years, especially in Asia, to build that rapport,” he says, “and you have to build it face-to-face.”

Bassanini says he’s seen major new export markets developed in South America, Asia and elsewhere thanks to vital funding from farmers’ checkoff dollars and USDA’s export promotion programs. But he warns that current concerns over U.S. trade agreements and tariff battles with China “create an environment of uncertainty,” forcing buyers and end-users to scramble to find new sources for the grain, soybeans, or other commodities they need to stay in business.

Vancouver, Wash.-based, United Grain operates grain terminals in Oregon, Montana, and North and South Dakota where, Bassanini says, “small farming communities are dependent upon grain exports for providing crucial revenue to those remote locations.” So, any threat to export growth will have a disproportionate impact on these farming areas. And he says that threat is already here.

“We continue to lose market share in terms of volume to competing major export hubs like South America, Brazil, Argentina, Russia and the Black Sea region,” he says. “If we are going to compete with them on a yield basis, I don’t think we are going to win that fight.”

Still, he says that despite headwinds, “we continue to expand our share in regions like Southeast Asia because competing countries are not able to deliver quality products on a consistent, reliable basis.” Maintaining these gains, he says, depends on the U.S. investing in improving supply chain efficiencies, upgrading the infrastructure needed to deliver product reliably, and avoiding even rumors about trade disruptions.

Disruption Concerns. Since taking office, the Trump administration has made several gains on the export front for agricultural products.

However, the administration has also unnerved trading partners by renegotiating the North American Free Trade Agreement (NAFTA), pulling out of the Trans-Pacific Partnership (TPP) and announcing tariffs on steel, aluminum and a variety of other products – prompting retaliatory threats from the Chinese and other countries.

Several U.S. agricultural groups say that one of the best ways to keep pressure on the Chinese and counter the Asian giant’s influence is for the U.S. to rejoin what used to be called the Trans-Pacific Partnership (TPP).

The U.S. Wheat Associates (USW) and the National Association of Wheat Growers (NAWG) welcomed the possibility of reviving the full 12-nation pact. “If the United States joins TPP, U.S. wheat should be able to compete on a level playing field with Canadian and Australian wheat,” said USW Chairman Michael Miller, a wheat farmer from Ritzville, Wash.

Representing 140,000 American wheat farmers, USW and NAWG wrote USTR’s Lighthizer in March, warning that “Lost market share is incredibly difficult to regain.” They pointed out that under new CPTPP rules, Japan will cut its tariffs on imported Canadian and Australian wheat to $85 per ton but keep the current $150 per ton tariff in place for U.S. wheat. While the change will phase in over nine years, the wheat groups said the “loss in market share and its negative effect on farm-gate prices are likely to come much sooner, as Japanese millers reformulate their product mix to avoid the need to purchase artificially expensive U.S. wheat.”

Hopes were also raised that the farm sector’s major role in the U.S. economy would translate into White House support for increasing rather than flat-lining or reducing funding for the two USDA cost-share programs that, in partnership with farmer-funded checkoff dollars, have played a vital role in expanding U.S. farm sales abroad: the Market Access Program (MAP) and the Foreign Market Development (FMD) Program.

Export promotion legislation. To support these programs, last September Sen. Angus King, I-Maine, introduced S. 1839, the “Cultivating Revitalization by Expanding American Agricultural Trade and Exports Act.” Along with the companion House bill, H.R. 2321, King’s CREAATE bill would steadily raise MAP [and] FMD funding.

The House version of the new farm bill takes a different approach. USDA’s trade programs, including the MAP and FMD, would be combined under a new International Market Development Program … Under current law, only MAP would have funding after this year under the expiring 2014 farm bill. Combining the programs would ensure all the programs have a permanent funding baseline. Boosting both ag exports and export promotion funding has become vital to both the rural and the national economy.

Success in the Philippines. Based in Manila, USW Regional VP for the Philippines and South Korea Joseph Sowers is keenly aware of … aggressive competition. He says it’s an “uphill battle” to convince buyers to opt for premium-priced but better performing U.S. wheat. He also points to significant gains.

In the Philippines, Sowers says, “We have a program here where we invest in increasing consumption of wheat-based foods. And we’ve done it.” He adds that almost all the gains benefit the U.S. with its 97 percent market share, proving that “These kinds of investments are paying off.”

Key to this level of market dominance, Sowers insists, is being on-the-ground for decades with regional offices and regular seminars. He says this presence builds trust with buyers and end-users to the point that “decision makers trust us, they look to us for advice.” He considers [state wheat] checkoff, FMD and MAP funding vital to maintaining USW’s foreign offices and “absolutely essential to everything we do.”

“Our mandate is twofold,” Sowers says. “One is to create the greatest returns to our farmers, to the people who fund us. The other mandate is to make the local industry here the most profitable they can be, to increase their profits so they will buy from us.”

To make it all happen, Sowers hosts seminars year-round, with upcoming ones set for Manila, Bangkok and Jakarta, “talking to buyers about methods that they can use to decrease their purchasing price or to plan their purchases through the year. And then at the same time, have a mill management seminar showing them how to increase their profitability using, of course, U.S. products.”

Along with working to increase exports to developing markets like Sri Lanka and Malaysia, Sowers says Thailand, Indonesia and Vietnam offer “the most opportunity for huge increases in sales” and that new trade agreements offer the best way to make U.S. products more competitive.

New Coalitions. USW’s President Vince Peterson and VP of Overseas Operations Mark Fowler [say] with the farm economy struggling in an already down market, the tariff battle with China puts 1.5 million metric tons of U.S. wheat sales at risk just when unsettled NAFTA and TPP issues threaten sales to other major buyers like Mexico and Japan.

Peterson says the trade battles have “forced us to form coalitions” with other U.S. stakeholders and with “customers overseas worried about their supply relationship with us. They don’t like this any more than we do.” He says the new coalitions aim to alert the Trump administration to escalating impacts on U.S. agriculture from recent policy changes.

Peterson and Fowler tell Agri-Pulse that the strategy to success is to sign new trade agreements, complete the NAFTA negotiations without harming ag exports, reconsider joining the TPP, use the WTO dispute settlement process, and double funding for USDA’s MAP and FMD programs as … CREAATE legislation proposes.

Trade Battles Undermine U.S. Reputation as a Reliable Supplier. U.S. Grains Council President and CEO Tom Sleight warns that due to the trade battles launched by the U.S., “our loyal, longtime customers are actively looking at alternative sources of supply … We’re hurting our reputation not only in China, but with other trading partners, with key ones like Japan, Korea, Mexico. Even in places in Southeast Asia that are new and growing markets for the U.S., we’re creating doubt.”

“There are definite consequences if these battles do not get settled expediently and with proper attention to the impact on agriculture,” he says.

National Association of Wheat Growers President Jimmie Musick explains that with his wheat, cattle, alfalfa, cotton and sorghum operation in Sentinel, Okla., “it doesn’t appear like I raise a commodity that China [is] not [targeting] in their tariff trade war.” To help remove this threat, he wants the administration to understand “how important it is that we maintain good trade relationships and how devastating it will be to our farmers when China puts a 25 percent tariff on our commodities.”

Musick’s also at work on getting more support from farm-state members of Congress. He’d like them to persuade the administration to switch from tariffs to negotiations by offering in return to support legislation that’s on Trump’s priority list.

With today’s long list of farm and trade organizations linking arms as never before, Musick and his colleagues are hopeful their concerted pressure on Congress and the White House will pay off in terms of less turbulent waters ahead and continued growth in the U.S. ag export markets that they’ve worked so diligently to build over several decades.

thumbnail

The U.S. Congress is at the beginning of a long process to gain enactment of a new Farm Bill due by the end of the current fiscal year on Sept. 30, 2018. As a member of the Agribusiness Coalition for Foreign Market Development and the Coalition to Promote U.S. Agricultural Exports, U.S. Wheat Associates (USW) provides information to the coalitions and to the National Association of Wheat Growers (NAWG) needed to present priorities to U.S. legislators.

Last week, two events happened that potentially affect the work USW does to help its overseas customers gain value from purchasing U.S. milling wheat.

First was a letter sent from Rep. Dan Newhouse of Washington State and 43 co-signing members of Congress voicing strong support for USDA’s Market Access Program (MAP) and Foreign Market Development Program (FMD) as the process of writing a new farm bill begins in earnest.

The bipartisan request to House Agriculture Committee Chairman Michael Conaway of Texas and Ranking Member Collin Peterson of Minnesota urged reauthorization of both programs and incorporation of elements from H.R. 2321, the Cultivating Revitalization by Expanding American Agriculture Trade and Exports Act (CREAATE Act), which would phase in increases in annual funding for both programs.

The letter referenced the dramatically increased competition U.S. agricultural exports now face, supported by increasingly rich government-sponsored marketing from some of the top U.S. agricultural competitors.

The letter also explained that MAP and FMD dollars are matched by private-sector contributions from state and national checkoffs and small agriculture businesses. In 2014, those contributions made up 70 percent of all money invested by organizations participating in the programs and operating marketing efforts overseas. In today’s complex trade environment, promoting U.S. wheat and other agricultural products has never been more important. This is most successfully accomplished with robust global presence, which is supported through MAP and FMD.

Also last week, the first House version of the 2018 Farm Bill proposes a slightly different structure for export market development programs. It consolidates the programs into the “International Market Development Program” that includes Foreign Market Development, Market Access Program, Emerging Markets Program and Trade Assistance for Specialty Crops components. This consolidated program would maintain a budget baseline for the FMD component and provides continued funding for FMD and the MAP component at their current annual levels. The U.S. House Agriculture Committee passed this version of the Farm Bill, which will be debated by the full House.

More about the MAP and FMD component programs and the public-private partnership they represent is at www.agexportscount.org.

thumbnail

By Ben Conner, USW Vice President of Policy

Cuban President Raúl Castro stepped down this week, closing a six-decade chapter in Cuban history with a Castro leading the communist island nation. During Raúl Castro’s tenure, Cuba’s government has very slowly transitioned to authorize some private sector activity and taken modest steps towards improving relations with the United States.

Hopefully this transition of power will provide an opportunity for a new generation of Cuban leaders to accelerate reforms and further open their country to international trade and investment, while allowing a more free exchange of goods and services between themselves and with U.S. citizens and organizations.

Certainly, obstacles on the U.S. side remain, particularly the outdated trade embargo that prevents most U.S. exporters from assessing and taking their own risks in trade with Cuba. U.S. farmers stand to benefit if the U.S. Congress ends the embargo, which would open the door to the largest Caribbean island wheat market.

Since the most recent President Castro took over from his brother, Fidel, in April 2011, the Cuban government has not purchased any U.S. wheat. At its peak, Cuba was a 500,000 metric ton (MT) market for U.S. wheat, and today it regularly imports around 800,000 MT from other origins. While wheat trade is allowed with Cuba under current U.S. law, other U.S. restrictions make exports cost prohibitive, and the overall embargo poisons the well for any meaningful trade relationship.

This can and should change. U.S. wheat farmers need as many open markets as possible. A leadership transition in Cuba is not a frequent event; let us hope both sides make the most of it.

thumbnail

By Stephanie Bryant-Erdmann, USW Market Analyst

At first glance, the USDA April 10 World Agricultural Supply and Demand Estimates (WASDE) held very few surprises for wheat. Most reviewers would consider this a bearish report with another increase in predicted U.S. and global wheat ending stocks. However, a somewhat unnoticed factor was increased global wheat feed use, now forecast at 146 million metric tons (MMT), 7 percent above the 5-year average. This was due largely to shrinking supplies of traditional feed grains. With an average 19 percent of global wheat production being used as feed each year, the current feed grain supply and demand situation has implications for wheat.

A deeper look at the feed grain situation shows the most striking decrease was in global corn production, which fell 4 percent year over year to 1.04 billion metric tons due to sharply lower production in drought-stricken Argentina and lower second-crop corn production in Brazil. At the same time, 2017/18 corn feed demand grew 18.0 MMT. These facts set up a total stocks-to-use ratio of 19 percent. However, it is important to note that China holds 40 percent of the world’s corn stocks, which will not leave the country.  Removing China from the equation brings the stocks-to-use ratio down to 14 percent.

The constrained corn supply caused USDA to reduce global corn feed demand by 4 MMT from the prior month’s estimate of 654 MMT. In addition to reduced corn feed use in Argentina, USDA noted decreased corn feed demand in the European Union (EU) with a corresponding increase in wheat feed demand. EU 2017/18 wheat feed use is expected to reach 58.5 MMT, 9 percent above the 5-year average, if realized.

While corn had the most precipitous drop in supply and increase in demand, global production of barley, millet, oats and sorghum also fell in 2017/18, while rye remained stable year over year. Including corn, global feed grain production fell 4 percent or 49.9 MMT year over year in 2017/18, while global feed grain consumption increased 15.1 MMT. The increased consumption and decreased supply of traditional feed grains will cut 2017/18 ending stocks for those grains by 38.8 MMT.

With the global feed grain supply tightening, prices for those commodities continue to rise. Since the beginning of 2018, world feed barley prices increased an average $19 per metric ton (MT), global sorghum prices averaged a $15/MT increase, and the average world corn price increased $26 per MT, according to International Grain Council (IGC) data. Supported by increased feed wheat demand, global wheat prices also increased an average $9 per MT.

With feed grain prices increasing, farmers around the world have taken notice and are expected to plant more corn, barley and sorghum in 2018/19 — at the expense of wheat.

IGC expects 2018/19 global wheat harvested area to fall to a six-year low of 538 million acres (218 million hectares), down 1 percent from 2017/18 levels. The analyst group expects generally favorable Northern Hemisphere weather to increase global yields and partially offset the reduced planted area. Still, IGC currently forecasts 2018/19 global wheat production to fall 17 MMT year over year to 741 MMT.

Weather news is dominating the futures markets right now, but customers should be mindful of the feed grain situation, which is slowly siphoning some of the world’s excess wheat stocks in 2017/18 and switching wheat planted area to feed grains.

To track U.S. wheat prices, please subscribe to the U.S. Wheat Associates (USW) Weekly Price Report.

thumbnail

By Neal Fisher, Administrator, North Dakota Wheat Commission; Reprinted from “Dakota Gold

[Editor’s Note: While Mr. Fisher’s article focuses on North Dakota’s agricultural products, the key points are relevant to every state that produces wheat for export.]

International trade and those affected by it have become a prominent main street topic in recent weeks as the United States and U.S. trading partners wrestle with an increasingly contentious global trade atmosphere. There have been some positive outcomes in recent negotiations, with revisions and updates to KORUS, the U.S.-Korean trade agreement, cited by U.S. trade officials as an example. South Korea is a very important export market for U.S. wheat (fifth largest), beef (largest) and other agricultural products.

U.S. agricultural exports were valued at $140.5 billion in 2017, and with a $30 billion trade surplus, agriculture is the only sector of the U.S. economy to consistently register a trade surplus, exporting more than we import. Agricultural exports also account for one third of U.S. gross farm income and generate 8,000 jobs for every $1.0 billion in exports, or 1.1 million jobs last year. But U.S. agricultural interests have become increasingly concerned, ever since the U.S. withdrew from the Trans Pacific Partnership (TPP), a very important trade agreement and missed opportunity.

U.S. wheat industry representatives and most in U.S. agriculture agree U.S. trade negotiators should be strongly encouraged to seek re-engagement in the TPP process and help President Trump get his better deal. TPP in its current form, without the U.S., has 11 country members and was signed in early March 2018. The reasons for U.S. re-entry are arguably many, but without re-engagement it appears certain that U.S. producers stand to lose very serious market share in many of their best customer destinations, while our competitors will enjoy much lower tariffs and gain market share. Comparatively higher tariffs could disadvantage U.S. wheat producers in a key market like Japan by as much as $2 per bushel and eventually impact other important markets. The TPP-11 tariff structure with Japan, a long time top U.S. spring wheat user, will be gradually reduced over five years for our chief competitors, Canada and Australia, both TPP-11 signatories, as implementation progresses. For wheat producers, other top end Asian customers are also members of the new TPP-11, further strengthening the case for U.S. re-engagement in the process.

The ability to trade, build long term market relationships, and protect hard won market shares in key customer destinations is extremely critical for North Dakota agriculture, our state’s primary industry, economic engine, and revenue generator. This has been the case for a very long time and remains so today. Trade in an environment that is as free flowing as possible, as fair and as rule-based as possible, or as fair and free as can be negotiated, is mostly a desirable situation. In contrast, several memorable historic events that were in part attributed to diplomatic and trade frictions include: commodity embargoes four decades ago that precipitated devastating economic downturns in U.S. agriculture and the North Dakota economy, earlier (national) isolationist trends that have long been linked as catalysts to epic world wars, and other historic conflicts over trade routes, and the goods that have for centuries traveled over them.

Most of what is produced in North Dakota with a lot of determination, effort and efficiency, must find its value and therefore a market beyond our state’s borders, whether our product is agricultural, or not, processed, packaged or refined, or not, or involves the latest technology and accompanying intellectual property rights, or not. These goods have always generated much more value if those who want or need to access them and are willing to pay premium prices, can readily do so. Producers benefit from stronger demand, increased marketing opportunities, and potentially stronger prices.

Trade policy experts often remind us that 95 percent of all potential customers (global population 7.6 billion) reside outside of the United States (population 350 million). In the wheat industry on average 85 percent of the annual production leaves North Dakota (population 750,000) for premium markets in other parts of the U.S. and hundreds of individual premium market destinations in nearly 80 foreign countries each year. On average North Dakota produces more than 50 percent of total U.S. HRS production. There is typically a 50/50 split between domestic consumption throughout the U.S., and the export market, where U.S. hard red spring (HRS) wheat also garners the highest prices of any wheat traded in the global market.

Sales to Asian destinations with high quality tastes and demand have accounted for more than 70 percent of that export business, with the remainder moving to quality conscious markets in Europe and Latin America. Explosive market growth is expected to continue in Asia, particularly in the Philippines, Indonesia, Taiwan, Korea, Vietnam, Malaysia, Korea, and China where most of these countries are centers of growth in population, middle class incomes, and quality wheat demand. The Philippines has already surpassed Japan, the longtime top destination for U.S. and North Dakota HRS. Nearly all of these countries are on the U.S. HRS top 10 customer list. Total U.S. HRS exports to Asia alone averaged 175 million bushels over the past five years and reached 210 million last year. These hard-won markets have been earned with high quality, reputation, trade service, and significant producer checkoff investment.

North Dakota is very likely affected more by trade policy and other agriculture related policy decisions than almost any other state. A recent USDA map shows 2018 total prospective acreage of principal crops at 24.0 million acres in North Dakota, topped only by Iowa’s 24.3 million. Kansas came in third, at 23.5 million, Illinois fourth, at 22.7 million and Texas fifth, at 21.8 million. After Minnesota’s 19.5 million acres and South Dakota’s 17.6 million, planted acreage of USDA’s principal crops falls off pretty quickly in the rest of the U.S. with 30 states under 5 million.

North Dakota production of primary crops and livestock over the past decade has been valued at an average of $8.2 billion as annual gross cash farm gate sales (simply price X quantity). Over the same 10-year period those annual values have ranged from $6.1 billion in 2009 to 11.6 billion in 2012, according to USDA-NASS reports. Crop insurance and Government payments would add an average of $680 million to the 10-year average, raising it to $8.9 billion per year over the decade from 2008 through 2017. As expected these additional payments tend to augment the gross cash value of actual production in the lower performing years, helping to stabilize producer incomes and the value or contribution of the industry to the economy year over year, as intended.

Agriculture remains an extremely important part of the economy of the state of North Dakota and the nation as a whole. The continued productivity of our agricultural sector and the phenomenon of international trade makes much of this possible.