thumbnail

By Stephanie Bryant-Erdmann, USW Market Analyst

Three months into the 2017/18 marketing year (June to May), total U.S. export sales-to-date of 12.1 million metric tons (MMT) are 2 percent ahead of last year’s pace and in line with the 5-year average pace. Though hard red winter (HRW) and hard red spring (HRS) sales are currently below last year’s levels, both are ahead of the respective 5-year averages. As of Aug. 24, total sales to eight of the top 10 2016/17 U.S. export markets are higher than last year. In addition, the other three U.S. wheat classes are all ahead of last year’s pace. USDA projects 2017/18 exports will fall to 26.5 MMT, which, if realized, would be 8 percent below 2016/17, but 1 percent above the 5-year average pace.

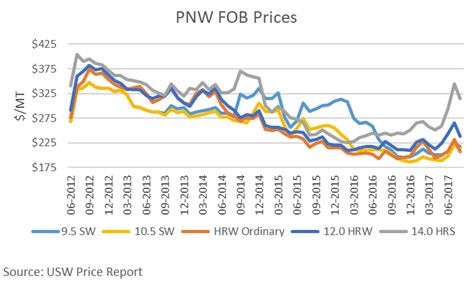
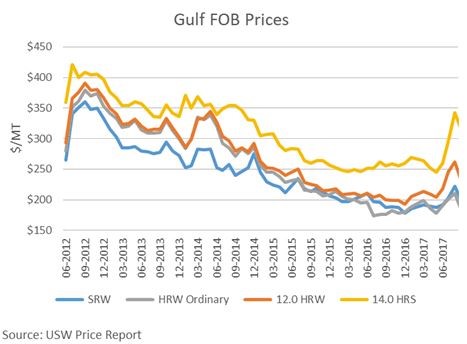
USDA reported HRW year-to-date exports at 4.49 MMT, down 7 percent from the prior year but 10 percent ahead of the 5-year average due to competitive prices and good quality. Mexico is currently the number one HRW purchaser. As of Aug. 24, before Hurricane Harvey’s catastrophic flooding closed Texas Gulf ports, HRW sales to Mexico totaled 973,000 metric tons (MT), up 72 percent from last year’s pace. Sales to Nigeria are also up 19 percent year over year at 488,000 MT. HRW purchases by Indonesia total 335,000 MT, three times greater than last year’s sales on this date. To date, HRW sales to Algeria totaling 273,000 MT are five times greater than the 2016/17 pace. It is too early to tell if Texas Gulf closures will affect total exports for 2017/18, but current reports suggest that rail and port facilities are making good progress toward resuming operations (Read more in Rail and Port Operation Recovery in Texas Gulf is Encouraging, below).

Sales of soft red winter (SRW) for 2017/18 are up 8 percent year over year at 1.19 MMT due to the excellent quality of this year’s crop. As of Aug. 24, total sales to four of the top 10 U.S. SRW export markets from 2016/17 are higher than last year. Sales to Mexico are 12 percent ahead of 2016/17 at 472,000 MT. Colombian SRW purchases total 121,000 MT, up 50 percent from last year. Sales to other Central and South American countries, including Ecuador, Peru, Panama, Brazil, Guatemala and El Salvador, are also ahead of the 2016/17 pace.

HRS sales of 3.26 MMT are down 13 percent year over year, but remain 4 percent above the 5-year average. Higher prices due to smaller 2017/18 production have slowed HRS exports thus far in 2017/18, but global demand for HRS is strong. As of Aug. 24, buyers in the Philippines held the top purchaser post with 746,000 MT, up 27 percent from 2016/17. Sales to seven of the top ten HRS customers are also ahead of last year’s pace. Sales to Japan of 475,000 MT are up 25 percent from last year’s sales on the same date, while year-to-date sales to Taiwan of 321,000 MT are up 93 percent from 2016/17.

As of Aug. 24, exports of soft white (SW) wheat are up 47 percent year over year at 2.93 MMT. That is 56 percent greater than the 5-year average. Sales to nine of the top 10 SW customers are ahead of last year’s pace. Philippine millers purchased 578,000 MT, up 19 percent compared to last year’s sales on the same date. South Korean sales are up 65 percent at 477,000 MT. Sales to Japan are up 24 percent year over year at 301,000 MT. U.S. SW sales to China, Thailand and Indonesia are also up. Year-to-date, Indonesia has purchased 266,000 MT, compared to total 2016/17 purchases of 193,000 MT. Thailand sales are up 72 percent year over year at 147,000 MT. Chinese purchases of 271,000 MT are already greater than 2016/17 total SW sales.

On average, 24 percent of U.S. total durum sales occur in first quarter of the marketing year, compared to 29 percent from September through November. Year to date durum exports total 211,000 MT, up 20 percent from the same time last year, still 14 percent below the 5-year average. Many durum buyers may be waiting for final quality reports for the Canadian crop before making purchasing decisions. To date, Nigeria, the European Union (EU), Algeria and Nigeria are the top durum buyers. A significant portion of the first quarter 2017/18 sales is designated as “sales to unknown designations.”

thumbnail

U.S. farmers produced lower volumes of a very good SRW crop for marketing year 2017/18. This SRW crop has uniformly low dockage, good test weight, somewhat lower protein, very good kernel size and weight, low DON values and no notable pockets of low falling number. Flour extraction rate is somewhat lower than last year.

That is a good summary of results from USW’s 2017 SRW Quality Survey Report, now posted online at www.uswheat.org/cropQuality. To complete the report, Great Plains Analytical Laboratory in Kansas City, Mo., collected and analyzed 270 samples from 18 reporting areas in the 11 states that account for 77 percent of total SRW 2017 production. USW and the USDA FAS fund the annual SRW survey.

Economic conditions kept 2017 SRW seedings down and USDA estimates production at 8.3 MMT. That is down from 9.4 MMT in 2016 and well below the 5-year average. However, USDA estimates that the total SRW supply (excluding imports) for the 2017/18 marketing year is 4 percent higher than 2016/17 because of higher 2017/18 beginning stocks.

The overall average 2017 SRW grade is U.S. No. 2. The overall weighted average test weight is 59.1 pounds per bushel, which is above the 5-year and 2016 averages. The Gulf Port average is similar to 2016, while the East Coast average is well-above its 2016 average. The Gulf Port dockage value of 0.3 percent is lower than any recorded in the previous five years. Other grade factors, including moisture and dockage for both areas are similar to or better than the 5-year averages.

The survey indicates almost no significant quality issues with the crop in any area. Average wheat protein content of 9.5 percent (12 percent moisture basis) is similar to last year and only slightly below the 5-year average of 9.8 percent. The 2017 East Coast and Gulf Port protein averages are similar. However, the East Coast average protein of 9.4 percent is below the region’s 2016 and 5-year averages, while the Gulf Port average of 9.5 percent is above the region’s 2016 average of 9.1 percent and slightly below its 5-year average. The composite average falling number of 319 seconds is below 2016, but above the 5-year average. The composite DON average of 0.4 ppm is below the 2016 value of 0.6 ppm and well-below the 5-year average of 1.3 ppm, indicating that the crop sampled is relatively free of DON. The East Coast DON value of 0.8 ppm and the Gulf Port value of 0.3 ppm are both below last year’s values and 5-year averages.

A summary of flour and baking data shows Buhler laboratory mill flour extraction averages overall are below the 2016 and 5-year averages. The composite farinograph peak and absorption values are similar to 5-year averages, but the stability value of 2.2 minutes is slightly shorter than last year and the 5-year average. The Gulf Port peak and stability averages of 1.3 min and 2.4 min, respectively, are similar to last year and the 5-year averages, while the East Coast peak and stability values of 1.2 min and 1.7 min are both shorter than last year and the 5-year averages. The composite and Gulf Port alveograph W values of 91 and 93, respectively, are higher than the 5-year averages. The East Coast alveograph W values and the remaining L and P values for the composite and both regions are all similar to the 5-year averages, given the variability of alveograph analysis. The composite and Gulf Port cookie spread ratios are lower than last year and the 5-year average while the average loaf volumes are all similar to last year and the 5-year averages.

Buyers are encouraged to construct specifications carefully to be sure they receive qualities that meet their needs either for traditional soft wheat products or for blending with higher protein wheat.

USW will share complete data for all classes of U.S. wheat with hundreds of overseas customers at USW’s annual Crop Quality Seminars, and in its annual Crop Quality Report.

By Stephanie Bryant-Erdmann, USW Market Analyst

Sharply lower U.S. wheat production pushed futures prices to 2-and 3-year highs earlier this summer. However, bearish factors have recently pushed prices down. And when wheat futures are under pressure, wheat importers have the opportunity to lock in competitive prices and maybe even find some bargains.

Chicago Board of Trade (CBOT) soft red winter (SRW) wheat futures and export basis are both under pressure from a growing 2017/18 (June to May) supply, which USDA estimated at 14.2 million metric tons (MMT). The year-to-date average SRW Gulf FOB value of $196 per metric ton (MT) is $50 below the 5-year average, and this is a very good quality new crop (for more information on 2017/18 SRW quality, read “Millers and Processors Should Like the 2017/18 Soft Red Winter Crop” below).

Though U.S. hard red winter (HRW) production is forecast to shrink 30 percent in 2017/18, year-to-date Kansas City Board of Trade (KCBT) HRW wheat futures average $58 per MT below the 5-year average. This is due mainly to KCBT contract specifications and lower average protein levels in the 2016/17 and 2017/18 crops. While HRW futures trickle lower, protein premiums continue to widen. Historically, Gulf HRW protein premiums ranged between $1.50 to $4.40 per MT for each additional 0.5 percent of protein. Pacific Northwest (PNW) HRW protein premiums normally average $2.95 to $7.35 per MT. In 2017/18, that range is now $11 to $32 per MT for the Gulf and $8 to $18 per MT for the PNW.

The widening protein premiums represent the tightening global supply of higher protein wheat. Yet FOB prices for 12 percent Gulf and PNW HRW are $40 and $41 per MT below the 5-year averages, respectively (all U.S. wheat protein is based on 12% moisture). Customers who can use lower protein HRW can take advantage of FOB prices for ordinary/unspecified protein HRW, which are $73 per MT below historic levels at the Gulf and $57 per MT below the 5-year average in the PNW.  Preliminary data shows 2017/18 HRW average protein is 11.5 percent, slightly above last year’s final of 11.2 percent, but below the 5-year average of 12.6 percent.

The Minneapolis Grain Exchange (MGEX) hard red spring (HRS) wheat futures have retreated from the 3-year highs reached earlier this summer. However, U.S. and Canadian spring wheat production estimates are supportive of current price levels. StatsCan expects Canadian wheat production (excluding durum) to fall 7 percent to 22.3 MMT. MGEX HRS futures are hovering near the August 5-year average of $6.79 per bushel ($249 per MT), but HRS export basis levels are $15 to $25 per MT below normal at both PNW and Gulf export locations. With harvest still underway in the U.S. Northern Plains and Canada, customers can mitigate some of their risk by locking in these competitive basis levels.

Export pricing for soft white (SW) wheat is not tied to a wheat futures market, but as noted in the July 27 Wheat Letter, protein premiums are shrinking for SW due to the excellent quality and more normal protein distributions in recent crops. PNW FOB export prices for 10.5 max protein SW are $62 per MT below the 5-year average, while FOB prices for 9.5 max protein SW are $70 per MT lower.

Well-informed customers can take advantage of these buying opportunities and lock in lower prices for high-quality U.S. wheat in the next few weeks. Your local USW representative is ready to help answer any questions about U.S. wheat pricing or the U.S. wheat marketing system. To track U.S. wheat nearby prices, review and/or subscribe to the USW Price Report here.

thumbnail

By Ben Conner, USW Director of Policy

On Aug. 16, 2017, the United States, Mexico and Canada began negotiations to modernize the North American Free Trade Agreement (NAFTA). The first round concluded on Aug. 20. It was historic, in the sense that this is the first time the United States has attempted to renegotiate all parts of an existing trade agreement.

The Mexican market is extremely important to U.S. wheat farmers, and duty-free access under NAFTA to U.S. wheat is extremely important to Mexican flour millers. As the top export destination in marketing year 2016/17, Mexico accounted for 12 percent of all U.S. wheat exports. This growth stems without doubt from a successful trade agreement that has provided positive economic opportunity for a growing Mexican middle class that is able to spend more money on products made from U.S. wheat.

It is too early to say what kind of outcome to expect, but U.S. agriculture has been emphatic in its message to “do no harm” in these negotiations to the agricultural industry and its customers. That was reflected in the opening remarks of Ambassador Lighthizer, the U.S. Trade Representative, when he acknowledged the importance of NAFTA to U.S. farmers.

However, he also said the agreement had fundamentally failed many parts of the U.S. economy and required major changes. As the negotiations move forward, we will find out what changes will be proposed and acceptable to all three parties — and what tradeoffs will be required.

One change that would benefit wheat farmers and the wheat trade, particularly in northern border states, is a commitment from Canada to treat U.S. wheat farmers equitably when delivering across the border to a Canadian elevator. The current system is a legacy of the old Canadian Wheat Board monopoly, and there is broad recognition that it should be updated to allow reciprocal treatment for U.S. and Canadian farmers.

As these negotiations continue, USW, the National Association of Wheat Growers (NAWG) and other agricultural organizations will be vigilant in pursuing the interests of the North American food and agriculture supply chains.


thumbnail

As USW President Vince Peterson often says, at any given hour of the day, there is someone, somewhere, talking about the quality, reliability and value of U.S. wheat. Wheat Letter wants to share just some of the ways USW was working in June and July to promote all six classes of U.S. wheat in an ever more complex world grain market.

Thailand. USW Baking Consultant Roy Chung, from the USW Singapore Office, conducted the annual 3-week Cookie and Cracker short course for 24 participants from across the South Asia region. As usual, there were more applicants than available spots. Participants noted that the course helps in applying new technology in their operations, developing new snack foods and other products and improving production processes, formulations and end product quality by using U.S. SW and SRW wheat classes instead competing origin wheat.

Morocco. The USW Casablanca Office continues to use the Quality Sample Program (QSP) for the Moroccan Milling Training Center (IFIM) in Casablanca. The milling school tests all classes of U.S. wheat and conducts blending activities. Through the USP program, USW arranged for procurement and shipping of three containers of HRS and SRW wheat for the milling school. Over the next few months, USW will lead many promotional and training seminars to showcase U.S. wheat quality and functionality to millers and end-product manufacturers from Morocco and neighboring countries.

Philippines. USW Baking Consultant Gerry Mendoza, from the USW Manila Office, conducted a short course on Bakery Operations Management at the Filipino Chinese Bakery Association Training Center in cooperation with the Philippine Society of Baking. Mendoza focused on increasing knowledge of four key elements that every bakery owner or manager must fully understand to help increase operational efficiency and profitability: ingredients, equipment, recipes and process.

Mexico. USW Technical Specialist Marcelo Mitre, from the USW Mexico City Office, worked with USW Baking Consultant Didier Rosada to conduct a series of baking seminars in Mexico City and Toluca. USW designed the seminars to help bakeries adapt to growing demand and requirements for tastier and healthier bread products, which supports consumption growth. Management for both bakeries confirmed their interest in launching some variations of these products in selected stores, as they realize there is a market for the quality end-products demonstrated in the seminars.

Jamaica. Technical Specialist Mitre worked with USW Baking Consultant Bernard Bruinsma to conduct two baking seminars in Kingston. The seminars focused on the entire baking process and allowed participants to test how their practices affect the quality of the end-product.

Ecuador. The USW Santiago Office and USW Baking Consultant Didier Rosada worked with bakery personnel in Quito, Ecuador. Rosada demonstrated using U.S. wheat flour blends to make par-baked bread that can be frozen and distributed. He also helped formulate new baked goods that will appeal to consumers and identify appropriate U.S. wheat flour blends for existing and newly formulated products.

Indonesia. USW Regional Vice President Matt Weimar, and Assistant Regional Vice President Joe Sowers, both from the South Asia region, traveled to Jakarta to meet with key members of the wheat foods industry, including procurement managers and decision makers at key flour mills. Discussions focused on world and U.S. market analysis and quality information and learning more about the Indonesian market and its wheat quality needs.

China. USW and the Wuxi Buhler Company conducted a week-long milling seminar at the Wuxi Buhler Milling Training Center for millers. Together, USW Technical Director Peter Lloyd, from the USW Casablanca Office, and Buhler Milling Technician Vincent Shao focused on flour milling technology, wheat cleaning and tempering equipment, mill maintenance and management, laboratory testing and the solvent retention capacity (SRC) method of flour performance testing. The participants have the opportunity to further practice milling HRW wheat at Buhler’s test flour mill.

Taiwan. USW cooperated with the De Lin Institute of Technology to host a noodle cooking seminar for nutritionists and cooks from school lunch centers and catering companies in New Taipei City. The seminar participants designed 12 noodle meal packages, two kinds of steamed breads and one Chinese pastry for school lunch programs. This experience demonstrated different flour performance for making healthy Chinese foods.

thumbnail

Bakers around the world consider flour produced from U.S. wheat to be consistently high quality and versatile. That reputation is earned largely because wheat farmers grow excellent crops (supported by quality data from USW) the crops are delivered through the most efficient grain handling system in the world, and because USW invests trade service, technical support and more to serve the world’s wheat buyers and wheat food processors.

One of those technical experts is Bakery Consultant Roy Chung who, from a base in Singapore, has represented U.S. wheat for almost 40 years. He has consistently added value to U.S. wheat imports by introducing quality bread processing to the milling and baking industry across South Asia in conjunction with his USW colleagues and training program collaborators.

The association of such expertise and service with U.S. wheat’s reputation overseas is so well regarded that leading French yeast and fermentation products company Lesaffre asked Chung and USW to collaborate on an innovative publication called “Sandwich Bread in Words. A Glossary of Sensory Terms.” Lasaffre describes the booklet, published in January 2017, as a tool “to formalize a common vocabulary about sandwich bread, drawing on different cultures and incorporating a repeatable assessment method … to create a bridge to connect experts with consumers.”

Lasaffre’s baking ingredients and flour produced from HRS and HRW wheat classes are ideally suited for the high quality “sponge and dough” system bread products that Chung describes in the book: “The internal characteristics, like flavor, grain, texture, taste, mouthfeel … will determine if the customer returns for another loaf. The vested interest of the baker is to make the best possible looking and tasting product with the best ingredients available.”

Didier Rosada confirms that consumers around the world are looking for better tasting, more natural bread. He is a globally respected master baker and vice president of operations at Uptown Bakers, where he produces quality baked goods for food service and retail stores in Maryland, Washington, D.C., and Virginia. He is a frequent consultant with USW, particularly in Latin America.

“Baking is changing in a good way,” Rosada said. “At my bakery, my process is as natural as possible, with long fermentation time, like it used to be done, to bring back the flavor profile of a good bread, the keeping qualities and texture, etc. And the classes of wheat that we have in the U.S. are perfect for that. I am using a flour that is almost 100 percent hard red winter or sometimes combined with hard red spring wheat.”

thumbnail

Because no two crops are alike, the world’s flour millers, bakers and wheat food processors must have some assurance that the wheat they buy will meet their needs. That is why U.S. Wheat Associates (USW) and its partner organizations collect and analyze samples of all six classes of U.S. wheat, compile results and share that data around the world every year.

Legacy organizations to USW first identified the need to quickly gather and share new crop data more than 55 years ago. Now, wheat farmer checkoff dollars and Market Access Program (MAP) funding are invested to publish a complete picture of each year’s harvest. This commitment to transparency offers confidence in the data that, together with the trade service and technical support also funded by USDA Foreign Agricultural Service programs, helps differentiate U.S. wheat exportable supplies.

USW works with several wheat quality organizations to collect, grade and analyze thousands of wheat samples from local elevators and sub-lot samples from export elevators. Sampling begins with early winter wheat harvest and continues until the U.S. hard red spring (HRS) and northern durum harvests are complete, usually by early October, although if warm, dry conditions continue, that end may come early this year. The data is compiled by class and by production region with the soft red winter (SRW) class report coming first, followed by other individual class reports and a complete USW Crop Quality Report by late October. All reports are published on www.uswheat.org. The Crop Quality Report is also printed as a booklet in English, Spanish, French, Arabic and Mandarin.

USW then sends teams of its colleagues, farmers and wheat quality experts out to present that year’s data to its buyers. By mid-December, USW has presented the latest characteristics for all six U.S. wheat classes to hundreds of buyers, millers and processors in more than 25 countries. Buying decisions are made because of this effort; some are acted upon quickly. For example, with information they learned at USW’s 2015 Crop Quality Seminar, millers in Portugal imported HRS for the first time in three years.

U.S. wheat crop quality data extend what our farmers produce into competitive business information customers need. Without funding from farmers through their state wheat commissions, the MAP, and the support of federally-funded inspection and quality analysis labs, this essential service to overseas customers would not be possible.

thumbnail

By Stephanie Bryant-Erdmann, USW Market Analyst

USDA increased its estimates for world wheat production, consumption and trade in its August World Agricultural Supply and Demand Estimates (WASDE) report released today. USDA forecast global wheat production at 743 million metric tons (MMT), 3 percent above the 5-year average but still 2 percent below last year’s record. The global wheat consumption estimate increased to 737 MMT in 2017/18, up 4 percent from the 5-year average but down slightly from the 2016/17 record. USDA projects 2017/18 world wheat trade at 180 MMT, down 1 percent from last year but still 10 percent above the 5-year average, which would be the second highest on record. USDA also lowered its U.S. and Canada spring wheat supply estimates.

USDA forecasted U.S. wheat production to fall 25 percent year over year to 47.3 MMT. The drop is due to lower yields for spring wheat and durum as a result of the drought across the U.S. Northern Plains, but does not reflect abandoned acre data. USDA pegged U.S. spring wheat production at 9.91 MMT, down 26 percent from 2016/17 and 30 percent below the 5-year average, if realized.

Total 2017/18 U.S. spring wheat supply, which USDA pegged at 16.3 MMT, is down 22 percent from 2016/17 and results in a U.S. spring wheat stocks-to-use ratio of 24 percent. The ratio was 44 percent in the August 2016 WASDE and 51 percent in the August 2015 report. The current low stocks-to-use ratio seems supportive for U.S. spring wheat prices. Many in the industry believe supply will decrease further when abandoned acres are determined.  The North Dakota Wheat Commission noted in Assessing the Wheat Quality Council Tour 2017 Yield Estimate (below), …abandoned acres will certainly have a significant impact on final production for both spring and durum, but may not be fully reconciled until USDA releases its final harvested acreage report for the 2017 crops.”

The drought that is impacting the United States is also decreasing yield potential in Canada. USDA now estimates 2017/18 Canadian wheat production will total 26.5 MMT, down 16 percent from the prior year. The United States and Canada normally account for 60 percent of global high protein wheat exports.

Favorable spring wheat growing conditions in Russia and Kazakhstan may partially offset lower North American spring wheat production. Time will tell what quality and quantity of spring wheat is available for export, and at what value. Customers should remain abreast of current crop conditions, harvest conditions and U.S. prices and contact their local USW representative for any questions concerning the 2017/18 U.S. wheat crop.

Harvest Report

Reprinted with Permission from “Agweek,” August 2, 2017

[Editor’s Note: The original source for this article is the North Dakota Wheat Commission.]

The annual Wheat Quality Council (WQC) tour of the spring and durum wheat region took place the week of July 24, with the final yield result sparking questions and sharp criticism, especially in social media circles. The North Dakota Wheat Commission (NDWC) would like to acknowledge these concerns from producers, assess the crop tour yield estimate, and clarify some misinformation.

The wheat tour is organized by the WQC, based in Kansas City, not the NDWC. The tours are just a small part of the overall mission of the Council. Its primary focus is being a collaboration point and organization to test and evaluate new wheat varieties for end-use quality, and to ensure U.S. wheat production is meeting the quality needs of the wheat industry. It also serves to expand communication and education between wheat producers, wheat breeders, millers, bakers and other end-users.

The tour calculated an average yield of 38.1 bushels per acre for hard red spring wheat. While this is the lowest yield in about ten years for the tour, it was higher than expected by many producers, considering the severe drought conditions gripping nearly all western North Dakota. The NDWC agrees that this overall yield was higher than we anticipated based on weekly crop ratings and producer reports, and the WQC average yield needs to be looked at in its full context.

Why was the tour estimate higher than expected? Most routes covered central and eastern parts of the state, and higher yielding areas of Minnesota, with a lower than normal percent of field counts in western areas. This was not done intentionally; the tour has never taken routes into the far west portion of the state or into eastern Montana (also in severe drought). In more normal years when crop conditions are more balanced across the region, this has not been as big of an issue. However, in a drought year like this with high abandonment, it led to a lower than normal percent of field counts from western areas. The yield estimates given at the end of each day and at the end of the tour are simple averages. They are not weighted by production and there are no county yield estimates released. For durum, the average yield came in at 39.7 bushels per acre, which is well above the July USDA estimate of 27 bushels per acre for North Dakota. The tour routes did not cover the main durum producing counties in the state, which are facing the most intense drought conditions.

Accounting for abandoned acres is difficult, since yield reports are based on actual acres harvested for grain, not planted acres. It is well known that large portions of the crop are being abandoned due to the drought conditions in western growing regions, including South Dakota and Montana. Participants on the tour noted that on some routes, anywhere from 30 to 50 percent of the fields had been abandoned.

These abandoned acres will certainly have a significant impact on final production for both hard red spring and durum, but may not be fully reconciled until USDA releases its final harvested acreage report for the 2017 crops. Normal abandonment rates in the spring wheat region are 2 to 3 percent. The eastern acres will likely see normal abandonment, but portions of the western drought areas could be as high a 40 percent. In 2002, North Dakota abandoned 13 percent of its wheat plantings, and the rate was 23 percent in the 1988 drought. The question of abandonment is a concern in the market and once fully understood, it will have a big impact on final production; it is something buyers, producers and all involved in the wheat industry will need to focus on.

USDA’s July production report projected an average spring wheat yield of 38 bushels for North Dakota, 61 bushels for Minnesota, 26 for Montana, and 34 for South Dakota. All the USDA data is based directly on producer surveys with no objective yield surveys taken in fields. The upcoming August and September USDA estimates will follow the same pattern for yield, but it is uncertain when major adjustments for abandoned acres will be included. In its July estimate, USDA pegged planted acres of spring wheat in Montana, South Dakota and North Dakota at 8.55 million, and harvested at 8.22 million, reflecting a 4 percent abandonment level. For durum in Montana and North Dakota, it pegged planted acres at 1.75 million, with expected harvested acres at 1.7 million, just 3 percent abandoned. If final harvested area ratios fall to levels seen in 2002 across the region, there is another 1 million acres that need to be taken out from final production equations. This is a significant number, and some producers say it will be even higher.

Emotions are high this growing season, especially for producers in the heart of the severe drought conditions. The unexpected higher yield estimate and decline in prices since the beginning of July due to several factors has intensified these emotions. The wheat tour result is just one piece of information the markets react to. Two of the three days of the tour, the market moved higher, with analysts citing other factors as well, such as technical sell points, corn and soybean weather forecasts, and the start of spring wheat harvest impacting trends. The final harvest and yield report from producers themselves, as well as a full recognition of abandoned acres, and both domestic and international demand factors, will be the final driving forces in establishing the value of the 2017 crop.

When the full extent of the drought-impacted production areas is considered, it certainly appears the tour overestimated both spring wheat and durum yield potential in 2017. For durum, it is significant since likely two-thirds of the main region was not part of the survey routes. For spring wheat, it may not be as significant because there is strong yield potential in the eastern third of [North Dakota and] into Minnesota that will offset some, but not all, of the reduction in harvested acres in the west … Tour organizers have noted the strong negative reaction from producers from the final tour yield results. And also heard from the NDWC and producers during the tour about concerns over the lack of accounting for abandoned acres and lack of field counts in western areas. It will lead to some reevaluation of routes in future tours, or recognition of the need to weight yield counts to better account for significant crop condition difference between regions.

The tour has been conducted for more than 20 years, and has provided a great opportunity to build connections between producers in this region and some of its most important customers. This year may have added some challenges, but it also provides an opportunity to expand communication along all segments of the industry. Milers and other end-users of wheat grown in our region need to have producers be successful, for them to be successful.

thumbnail

Members of the International Longshore and Warehouse Union (ILWU) are crucial workers at U.S. export grain elevators. Overseas wheat buyers in the Asia-Pacific region likely recall the challenges faced in 2015 during a lengthy contract negotiation that occasionally interrupted the West Coast supply chain. Although the dispute was finally settled with a contract through June 2019, trade organizations representing shippers like the Pacific Grain Exporters Association and transportation providers encouraged the parties to consider negotiating a longer-term agreement.

On Aug. 4, union longshore workers at 29 ports in Oregon, California and Washington ratified a new, three-year contract extension with the PMA. The contract virtually eliminates the possibility of a labor-related disruption through July 1, 2022. The contract also increases wages along with health and pension benefits.

The new contract clearly adds operational stability to Pacific Northwest ports that loaded more than 13 MMT of U.S. wheat exports in marketing year 2016/17, representing almost 48 percent of total U.S. overseas sales. Along with the U.S. government’s commitment to continuous improvement of the Columbia-Snake River System, USW believes this is very good news for overseas wheat buyers and U.S. farmers.