thumbnail

By Claire Hutchins, USW Market Analyst

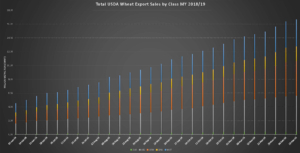
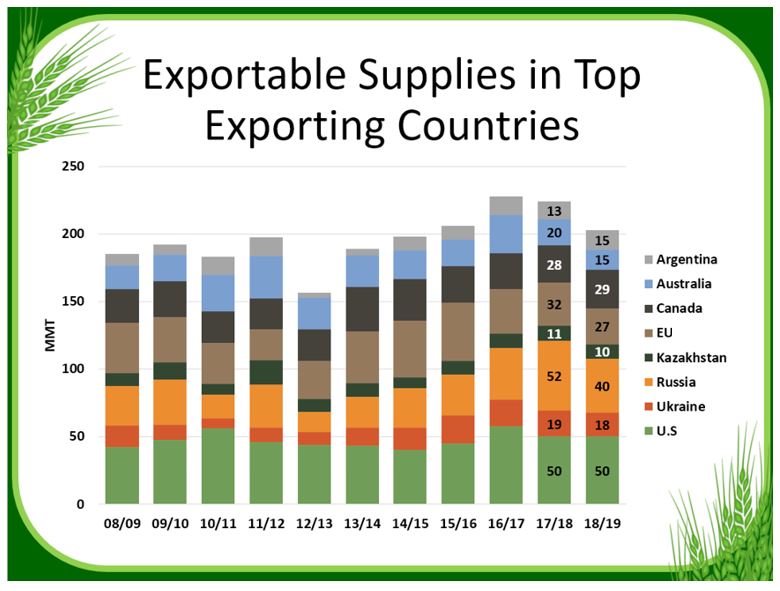
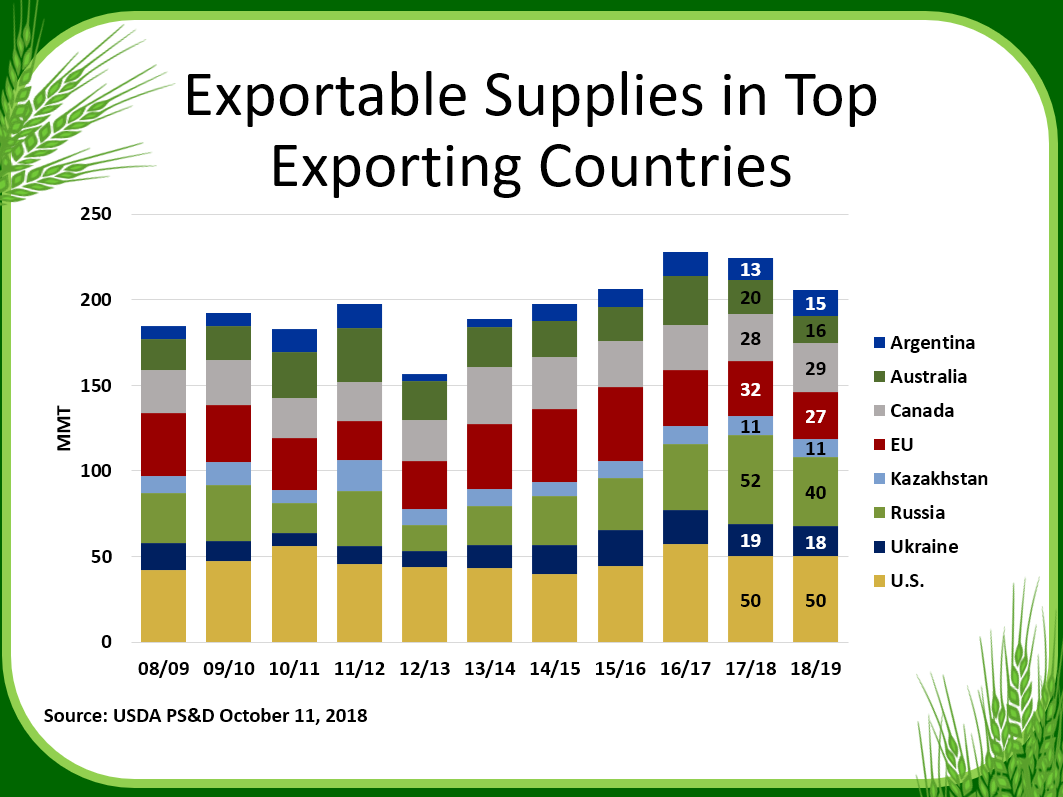
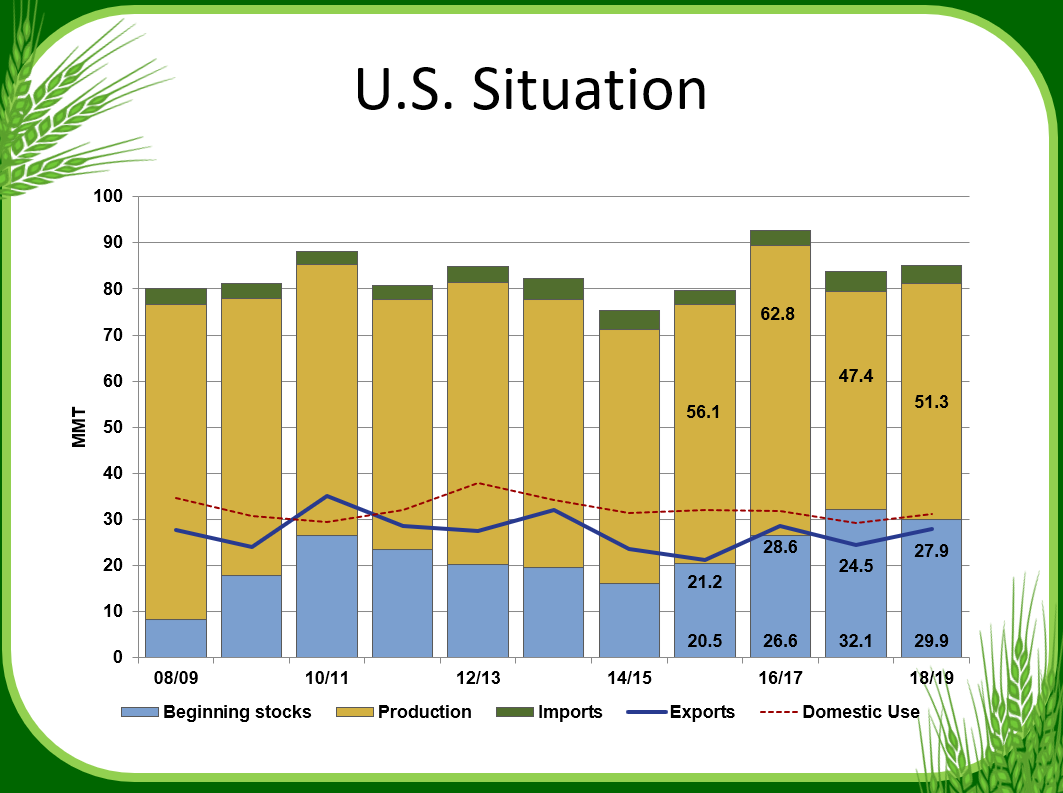
Despite challenging market factors, U.S. wheat exports for marketing year (MY) 2018/19, which ended May 31, totaled 25.8 million metric tons (MMT) (948 million bushels), in line with USDA’s adjusted export volume estimate. That is 9% ahead of MY 2017/18 and 1% ahead of the 5-year average of 25.5 MMT (937 million bushels). Commercial sales of all classes of wheat in MY 2018/19 exceeded 2017/18 levels due to abundant exportable supplies, excellent harvest qualities, competitive export prices and sustained service from U.S. Wheat Associates (USW) representatives supported by its state commissions and USDA’s Foreign Agricultural Service programs. This offset the bearish factors including a strong U.S. dollar, competitor’s advantages, uncertainty about U.S. trade policies and difficult inland transportation logistics.

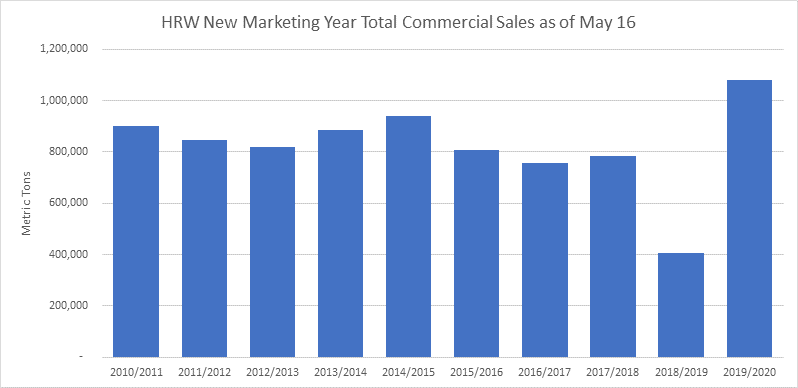
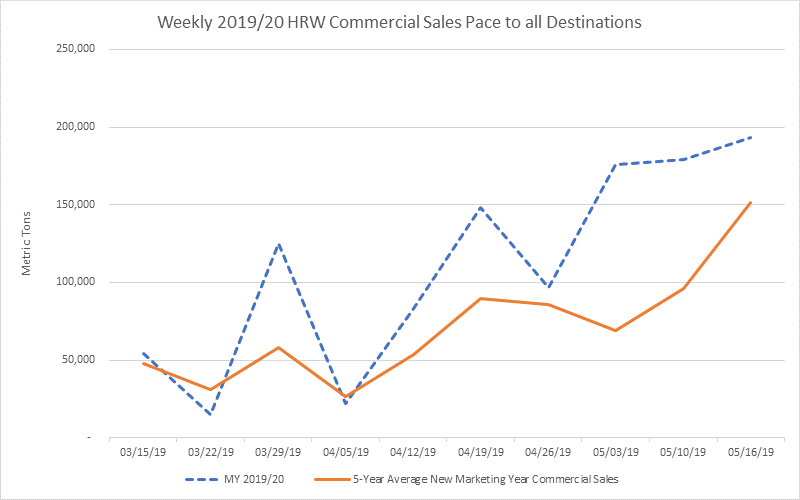
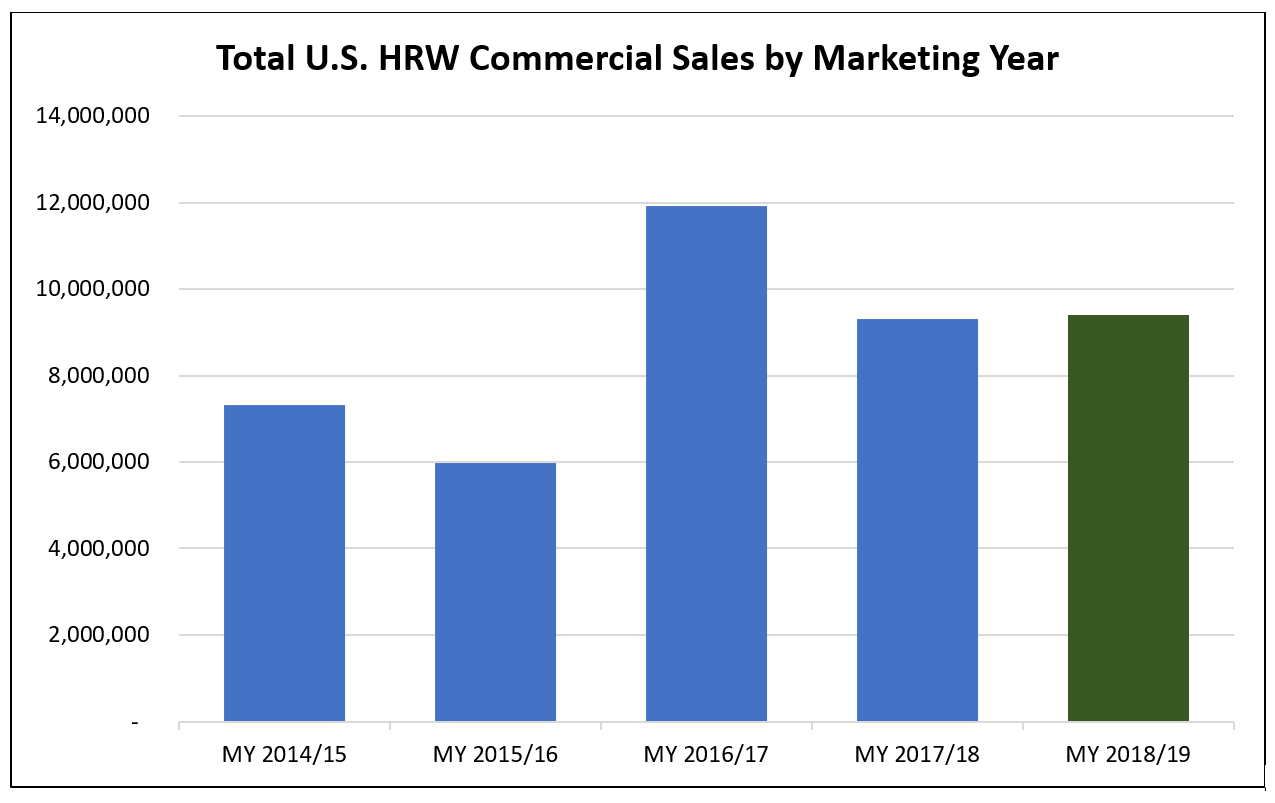
Hard Red Winter. USDA reported hard red winter (HRW) 2018/19 sales totaled 9.40 MMT (345 million bushels), 1% above 2017/18 and 1% above the 5-year average of 9.30 MMT (342 million bushels). Customers took advantage of the highest quality HRW crop in several years at attractive export prices compared to 2017/18. Out of the Gulf, between Jan. 1 and May 31, 2019, the average export price of U.S. HRW 12.0 protein (12% moisture basis) cost $227/metric ton (MT) compared to $257/MT over the same period in 2018. Sales to Mexico and Nigeria were up 6% and 36% respectively, while sales to Japan were down 6%. Sales to Mexico totaled 2.15 MMT (79.0 million bushels), 44% above the 5-year average of 1.49 MMT (55.0 million bushels), once again making Mexico the top HRW buyer. Commercial sales to Iraq, now the fourth-largest consumer of U.S. HRW, were in line with 2017/18 levels at 674,000 metric tons (MT) (24.7 million bushels).

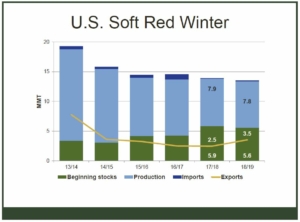
Soft Red Winter. 2018/19 soft red winter (SRW) sales increased 33% year-over-year to 3.33 MMT (123 million bushels), still 14% below the 5-year average of 3.92 MMT (144 million bushels) despite difficult inland transportation logistical issues due to major flooding on the Mississippi River and its tributaries. The 2018/19 SRW crop boasted higher protein levels and good extensibility, making it a valuable blending ingredient for cookies and cakes. A steady decline in SRW futures prices between mid-December 2018 and mid-May 2019 encouraged strong commercial sales to top SRW-importing regions. Export sales to three of the top five SRW purchasers increased or remained steady compared to 2017/18. Sales to Mexico, the top importer of U.S. SRW, increased 25% over last year to 917,000 MT (33.6 million bushels) and sales to Peru, the fifth-largest importer of U.S. SRW, increased 13% over last year to 175,000 MT (6.46 million bushels). Export sales to Nigeria held strong at 272,000 MT (9.96 million bushels).

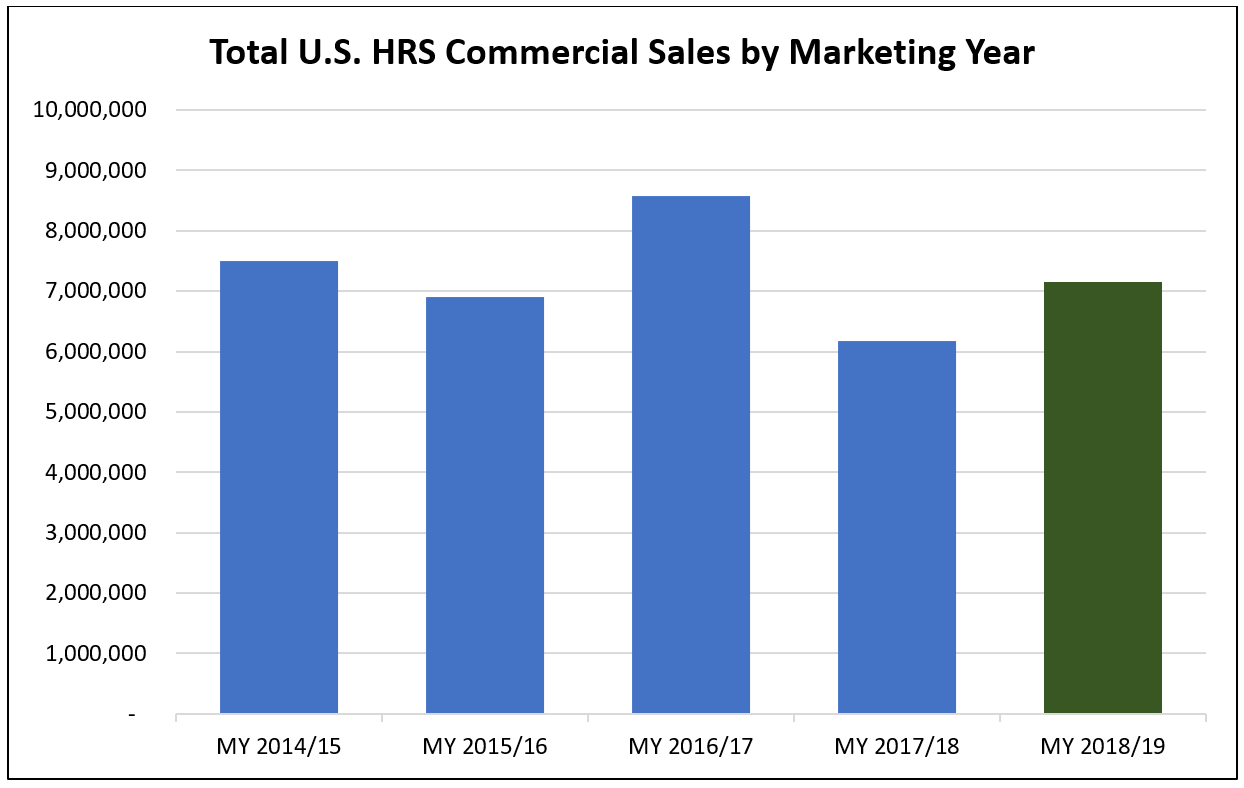
Hard Red Spring. By the end of MY 2018/19, hard red spring (HRS) export sales totaled 7.15 MMT (263 million bushels), 16% ahead of last year’s pace, despite a 94% decrease in commercial sales to China, formerly the fourth-largest importer of U.S. HRS. A 60% year-over-year increase in HRS production, at 16.0 MMT (588 million bushels), higher ending stocks, high protein content and competitive export prices all supported export sales. Gulf exports of HRS 14.0 protein between Jan. 1 and May 31, 2019, cost, on average, $263/MT compared to $305/MT over the same period in 2018. Seven of the country’s top ten HRS-importing partners increased commercial sales year over year. Commercial sales to the Philippines, the top importer of U.S. HRS, jumped to 1.85 MMT (68.0 million bushels) in 2018/19, 39% ahead of last year and 38% ahead of the 5-year average of 1.34 MMT (49.2 million bushels).

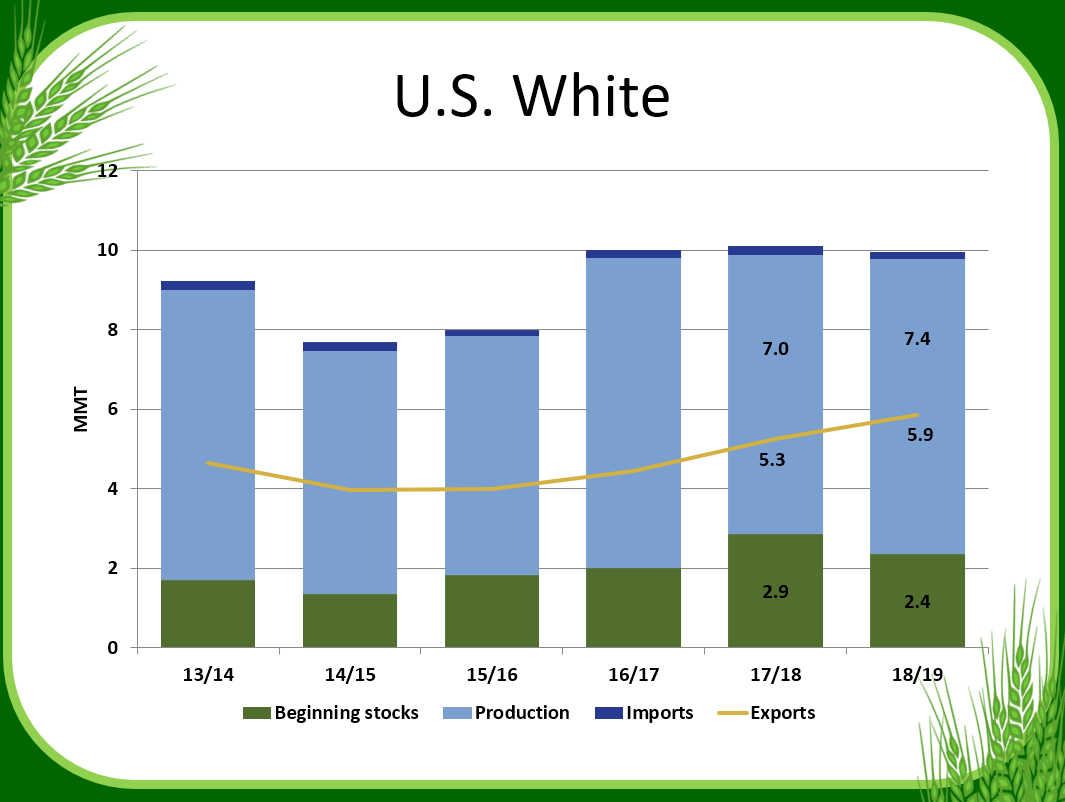
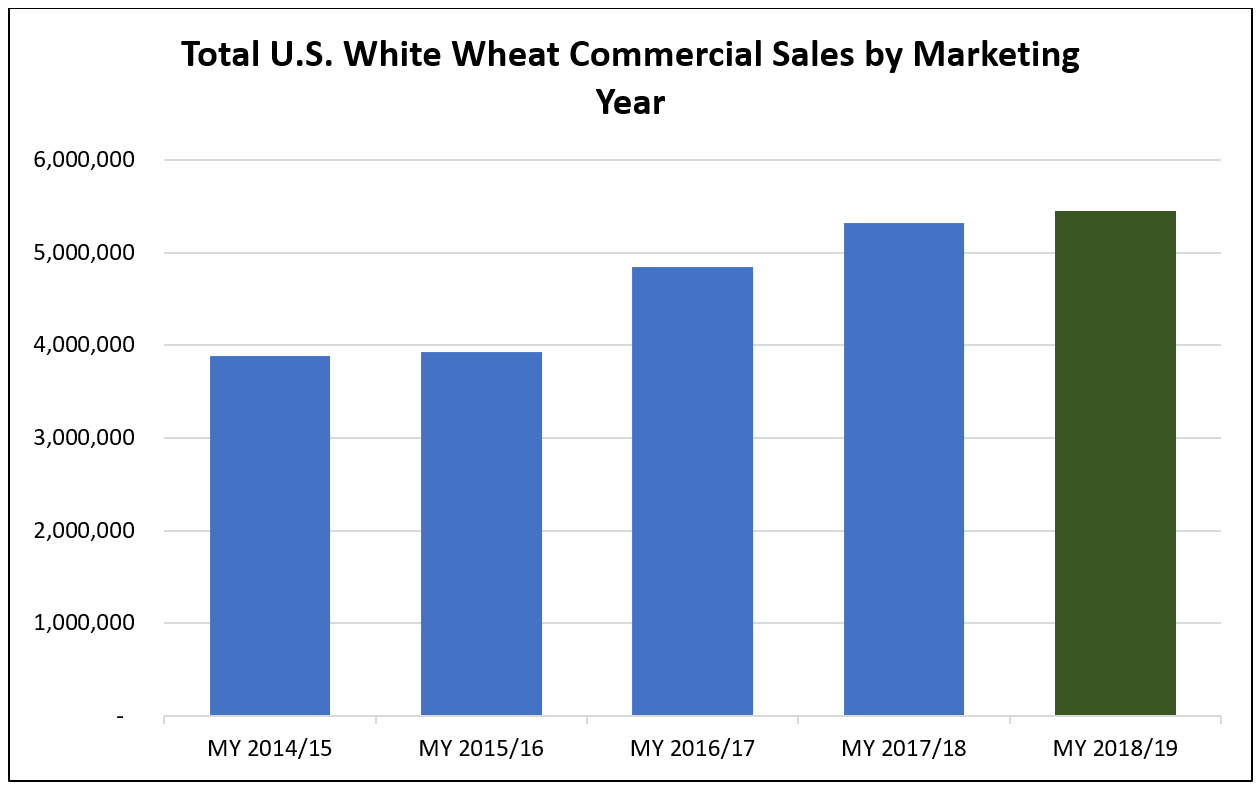
White wheat. Total commercial sales of soft white (SW) and hard white (HW) wheat climbed to 5.45 MMT (200 million bushels) in 2018/19, which includes about 165,000 MT of HW sales to Nigeria. That is slightly ahead of last year’s pace and 21% ahead of the 5-year average of 4.51 MMT (166 million bushels) due to increased production, increased exportable supplies and below-average protein levels compared to years prior. Sales to the Philippines and Japan, the top two importers of U.S. SW, respectively, increased 13% and 7% over 2017/18 levels. The Philippines purchased 1.32 MMT (48.9 million bushels) of SW compared to 1.17 MMT (43.0 million bushels) in 2017/18. White wheat sales to Japan increased to 889,000 MT (32.7 million bushels) compared to 829,000 MT (30.4 million bushels) in 2017/18.

Durum. USDA reported 2018/19 durum sales at 504,000 MT (19.8 million bushels), up 24% from the year prior, but 12% below the 5-year average of 573,000 MT (21.0 million bushels). Increased production, high protein content, excellent kernel characteristics and competitive prices throughout the marketing year all supported northern durum export levels. Increased sales to four of the five top markets for U.S. durum boosted export figures. The European Union (EU) purchased 290,000 MT (10.7 million bushels) of U.S. durum in 2018/19, up 71% year-over-year following a drought that cut production in many EU countries.

thumbnail

By Claire Hutchins, USW Market Analyst

Railroad rates and charges paid by customers who ship wheat and other grains make up a large portion of basis and have a direct effect on the price overseas buyers pay for U.S. wheat. Unfortunately, the cost of shipping wheat by domestic rail has been increasing at a rapid pace.

U.S. Wheat Associates (USW) and many of its state wheat commission members are spending more time investigating and commenting on the potentially adverse effects of increasing rail rates and separate charges on our overseas customers, shippers and even local farmers.

U.S. railroads are a crucial part of the most efficient grain supply system in the world. The rail system fulfills an essential logistical function that neither grain handlers nor farmers can perform on their own. Wheat must compete for limited rail capacity with other grains as well.

USW, however, has learned that since June 2014, the cost of wheat shipments has increased substantially, due at times to higher basic rates for shipping wheat and to added “demurrage” and “accessorial” (D&A) charges by Class 1 railroads (those with the largest systems). Demurrage charges occur when shippers do not receive, load or unload freight within a certain time period determined by the railroads. Accessorial charges are added to base transportation charges and can include demurrage, as well as costs to weigh rail cars, diversions from normal routes and other costs.

Recently, USW observed how agriculture is not the only industry negatively affected by these additional charges. USW joined more than 100 representatives across many sectors May 22 to 23, 2019, at a hearing held by the U.S. Surface Transportation Board (STB) to assess the fairness, reciprocity and efficiency of railroad D&A charges. The STB is a federal regulatory board that has broad economic oversight of U.S. railroads, trucking companies, water carriers and other transportation groups.

At the hearing, diverse stakeholder voices united under two common themes: D&A charges heavily favor Class 1 railroads and do little to improve overall service provided by railroad companies to shippers, receivers and intermediaries. Many shippers at the hearing said circumstances often prevent them from meeting what they consider strict railroad loading and unloading schedules, thus incurring the D&A charges. In some cases, stakeholders said they had to invest tens of millions of dollars in new infrastructure to accommodate railroad scheduling to avoid further demurrage costs.

In the case of wheat, as rail costs increase, the grain handlers may try to recover these costs by offering higher grain prices to terminal or export elevators and, some in the industry believe, by offering lower prices to farmers. As basis increases, overseas buyers must pay more for all classes of wheat out of the Gulf and the Pacific Northwest and that affects demand.

As rail costs increase, the grain handlers may try to recover these costs by offering higher grain prices to terminal or export elevators and, some in the industry believe, by offering lower prices to farmers.

Representatives from Class 1 railroads also attended the STB hearing and made the point that efficiency is good for all parties in the supply chain. They unilaterally agreed that D&A charges incentivize shippers to make more efficient loading and unloading decisions, which improves overall efficiency.

USW hopes the STB will carefully consider industry perspectives when assessing the fairness and efficiency of D&A charges because wheat producers and customers alike are adversely affected by increasingly high rail costs. USW believes lower rail costs could help U.S. wheat be even more competitive in a global marketing environment where only a small change in cost can make a big difference for farmers and their customers.

thumbnail

By Claire Hutchins, USW Market Analyst

As of May 16, total U.S. hard red winter (HRW) commercial sales for delivery in new marketing year 2019/20 reached a record 1.08 million metric tons (MMT). Weekly commercial sales of HRW for delivery in 2019/20 since early March 2019 are, on average, more than four times higher than new marketing year sales in 2017/18 for delivery in 2018/19 and are double each week’s 5-year average. Significant increases in new marketing year HRW exports to Algeria, Iraq, Nigeria, Saudi Arabia and Thailand contribute to the boost in 2019/20 sales.

Analysts attribute higher demand volume to ample exportable supplies and competitive global pricing.

U.S. Wheat Associates (USW) publishes a weekly commercial sales report every Thursday on Facebook, Twitter and here on its website.

thumbnail

By Steve Mercer, USW Vice President of Communications

Grown in the eastern United States, soft red winter (SRW) wheat is a profitable choice for producing confectionary products like cookies (biscuits), crackers and cakes, and to blend its flour for baguettes and other bread products. U.S. Wheat Associates (USW) wants to share some key points about SRW exportable supply in marketing year 2018/19 and look ahead to its potential for 2019/20.

1. Good Quality. While excessive rain on the 2018/19 SRW crop did slightly lower average test weight and falling number, protein (9.9% on 12% moisture basis, composite) is above average and DON level (0.7 ppm composite) is slightly below average. Processors should find good qualities for crackers and segments of the crop with good cookie and cake qualities. The higher protein and good extensibility in the crop should add value in blending for baking applications. See more information at https://www.uswheat.org/market-and-crop-information/crop-quality/.

2. Least Cost. SRW is the lowest cost milling wheat in the world today, offered at an average FOB export price of US$202 per metric ton* for June delivery from U.S. Gulf ports. The International Grains Commission in its March Grain Market Report estimated SRW FOB price at $211, which is $6 less than French soft wheat. SRW exportable supplies are also available from Lakes ports (Toledo, Ohio), and Atlantic ports (Norfolk, Virginia, and Wilmington, North Carolina). See more information at https://www.uswheat.org/market-and-crop-information/price-reports/.

3. Supply is Down. Ending stocks of SRW have declined from 5.9 MMT in 2016/17 to USDA’s latest estimate of 4.6 MMT for 2018/19 (by comparison, SRW ending stocks in 2013/14 were 3.1 MMT after China imported 3.6 MMT that marketing year). Reduced supply relates to a near 50% decline in total production from 15.4 MMT in 2013/14 to USDA’s current estimate of 7.8 MMT in 2018/19, as well as an upturn in exports (see below). See more information at https://www.uswheat.org/market-and-crop-information/supply-and-demand/.

SRW ending stocks have declined steadily since 2016/17 on less production and more exports. Source: USDA

4. Demand is Up. As of April 4, SRW exports of 3.3 million metric tons (MMT) are 36% more than at the same time in marketing year 2017/18. This represents the most volume SRW sales year to date since 2014/15. Commercial SRW sales to Mexico, Colombia, Peru, Ecuador and Brazil are up significantly, as are imports by Central American and Caribbean countries and Nigeria. See more information at https://www.uswheat.org/market-and-crop-information/commercial-sales/.

U.S. SRW wheat supplies are down; export demand takes an upturn. Source: USDA

5. Planted Area is Down. In February 2018, USDA reported that SRW seeded area for 2019/20 is 5.7 million acres (2.4 million hectares), or down 7% from last marketing year. Most of the states that typically produce the most exportable SRW supplies planted less. This decline is not more significant only because some farmers can harvest SRW and then quickly plant soybeans to get a double crop from the same acre. In general, U.S. crop farmers, who are driven by economic circumstances to minimize their net losses at best this year, are turning away from winter wheat to other crops that offer better returns. Total U.S. winter wheat seeded area for 2019/20 is at its second lowest level on record. See more information at https://www.nass.usda.gov/Publications/Todays_Reports/reports/wtrc0219.pdf.

*Source: USW Price Report, April 12, 2019

thumbnail

By Vince Peterson, USW President

Recently, I was searching online for some wheat market information to share at an upcoming meeting. I saw a headline that asked: “What country exports the most wheat?” Great, I thought, here we go again with more propaganda about Russia beating the United States in the global wheat export market contest.

Instead, I was quite pleased to scroll down to find that the United States was still the world’s largest wheat exporter in 2017 in terms of “value” according to the “World’s Top Exporters.” Russia produced almost twice the volume of wheat than the United States and more than matched U.S. export volume that year; but at an estimated $6.1 billion, U.S. wheat exports generated $300 million more value than Russian wheat exports.

The reason is clear: there are many private and public wheat buyers, millers and processors around the world that prefer the quality, variety and value of U.S. wheat; and that remains a primary asset to our farmers.

U.S. Wheat Associates (USW) has adjusted its allocation of wheat farmer dollars and program funds from USDA’s Foreign Agricultural Service to activities in markets that have a growing need for a variety of flour products with high quality functional characteristics. There our differential advantages shine through and where the investment offers the most return. On the other hand, USW continues to provide the trade servicing needed in the more cost-sensitive markets that are buying Russian wheat. There is value there, too, with a market environment like today’s in which the price spread between U.S. wheat classes and Black Sea supplies has narrowed. We continue to provide technical support to those buyers to demonstrate and build more knowledge about the true functional value of U.S. wheat. In addition, we are strong advocates for continuous improvement in wheat quality.

Looking ahead, I believe this is the right position for U.S. wheat in a global market with growing income levels, increasing urbanization and record setting consumption every year. It also reflects our mission: to enhance wheat’s profitability for U.S. producers and its value for their customers.


USW President Vince Peterson

thumbnail

By Claire Hutchins, USW Market Analyst

Due to the U.S. government shutdown, the U.S. Wheat Associates (USW) mid-year report on 2018/19 export sales reflects USDA export sales data through Dec. 13, 2018. Year over year comparisons are drawn from USDA data on Dec. 14, 2017. Though not current, the data still provides valuable insight into U.S. wheat export conditions as of late last year.

USDA continues to predict 2018/19 exports will reach 27.2 million metric tons (MMT), which, if realized, would be 11 percent higher than 2017/18 and 9 percent above the 5-year average. Total U.S. sales through the second half of the marketing year would have to reach 10.5 MMT to meet that estimate. USW expects the high quality and competitive pricing for select U.S. wheat classes will help push up the sales pace in the second half of the marketing year. Sales of soft red winter (SRW), hard red spring (HRS), and durum are all up year over year, while hard red winter (HRW) and soft white (SW) are behind last year’s pace.


Hard Red Winter (HRW)

USDA reports HRW year-to-date exports at 5 MMT, down 33 percent from Dec. 14, 2017. Export sales to Mexico dropped 14 percent year over year to 1.27 MMT, which USW believes can be attributed to a rocky trade relationship. In 2018, Russia produced its third largest crop of wheat. The significant volume of Russian Third Class held a firm FOB price advantage over U.S. HRW in the first half of the marketing year. Competition for HRW remains stiff in the price-conscious markets where Russia has a freight advantage, but the spread between Russian Third Class and U.S. HRW FOB prices has narrowed significantly since June 2018, a price convergence that could boost HRW demand. The 2018 HRW crop quality attributes significantly exceed the last two years and many of the 5-year averages, indicating that this is one of the highest quality HRW harvests in several years.

Hard Red Spring (HRS)

Total HRS sales of 5.2 MMT are up 4 percent from this time last year and fall right in line with the 5-year average. The HRS harvest was the largest in 22 years and boasts above average protein levels and excellent dough and bake qualities. That quality and competitive pricing* drive export demand as FOB prices out of the Pacific Northwest remain near a constant $255 per MT. The Philippines continues to import the largest volume of HRS at 1.4 MMT, which marks a 24 percent increase over last year’s pace. Sales to Vietnam are up significantly year over year to 132,000 MT, and sales to Thailand are up 50 percent at 338,000 MT. Only the tariff conflict with China, which has imported no U.S. wheat since March 2018, holds back current HRW sales.

*From November 17, 2017, to Nov. 18, 2018, U.S. HRS FOB prices declined nearly 20 cents per MT while competitor prices over the same period trended slightly higher.

Soft Red Winter (SRW)

Export sales of SRW through Dec. 13, 2018, are up 15 percent over 2017/18 at 2.15 MMT, driven by competitive SRW FOB prices. Sales to nine of the top 20 U.S. SRW export markets, including Brazil, Costa Rica and South Africa, are ahead of last year’s pace. Sales to Mexico are 10 percent ahead of 2017/18 at 605,000 metric tons (MT). Ecuador’s SRW imports stand at 147,000 MT, up substantially from last year.

Soft White (SW)

As of Dec. 13, 2018, export sales of SW are down 8 percent year over year at 3.9 MMT. However, total sales rise above the 5-year average by 20 percent. The loss of Chinese SW imports points to the drop in export sales year over year. The Philippines and Indonesia, two of our SW top markets, hold steady at 911,000 MT and 507,000 MT, respectively, compared to the 2017/18 pace. Sales to Yemen are 18 percent ahead of last year’s pace at 181,000 MT and sales to Thailand are 46 percent ahead of last year’s pace at 283,000 MT. SW customers are taking advantage of this year’s good test weight, lower moisture and lower protein content.

Durum

Year to date durum exports total 406, 000 MT, up 50 percent from Dec. 14 last year with increased import paces in all U.S. durum markets. Most notably, export sales to the European Union, already the largest buyer of U.S. durum, increased by 101 percent to 232,000 MT, supported by the crop’s excellent quality and competitive price. The 2018 harvest boasts high protein and excellent kernel characteristics, ideal for premium pasta products.

Hard White (HW)

USDA reports notable HW sales of 135,000 MT to Nigeria. This is the first significant export sales of HW in many years, as HW production is up slightly from the year prior and boasts high protein levels and good bread baking potential.

Looking Ahead

USDA projects a 4 percent increase in global wheat consumption over the 5-year average at 744 MMT. As exportable supplies from Russia, the EU and Australia begin to wane as we move into the second half of the marketing year, U.S. FOB prices for HRW, SRW, and HRS are more competitive now than they were in June 2018. This represents an advantageous opportunity for customers to extract even more value from the 2018/19 U.S. wheat supply.

By Stephanie Bryant-Erdmann, USW Market Analyst

USDA expects global wheat consumption to remain at record high levels in 2018/19 due to increased human consumption. Human wheat consumption is expected to reach a record high 602 million metric tons (MMT), 4 percent above the 5-year average. Over the past ten years, global human wheat consumption has increased 90 MMT, while feed wheat usage has increased 16 MMT.

However, the global supply of milling wheat is expected to fall this year due to challenging growing and harvesting conditions that hurt both quality and yields in many of the major wheat exporting countries. USDA expects global wheat production to fall to the lowest level in 5 years at 734 MMT, down 4 percent from the record high of 763 MMT in 2017/18. If realized, it would be 1 percent below the 5-year average and the first-time global wheat consumption has exceed global wheat production since 2012/13.

The decline in global wheat production is due to decreased production in half of the major wheat exporting countries including the European Union (EU), Russia, Australia and Ukraine. If realized, Russian wheat production would still the third highest on record, but Australian wheat production is expected to fall its lowest level since 2007/08.

Australian wheat production is expected to fall 18 percent year over year to 17.5 MMT due to consecutive years of devastating drought in New South Wales and Queensland where Australian Prime Hard (APH) and Australia Hard (AH) production is centralized. Increased wheat production in Western Australia is expected to partially offset the decrease from the rest of the country. Australian wheat harvest typically occurs in December. USDA expects Australian exports to decrease to 11.5 MMT, 35 percent below the 5-year average and also the lowest level since 2007/08.

With exportable wheat supplies (production plus beginning stocks minus domestic consumption) decreasing in half of the world’s major exporters, USDA expects the United States to have the largest exportable supply of wheat in the world in 2018/19 at 49.9 MMT.

As a consequence, USDA expects 2018/19 U.S. wheat exports to reach 27.9 MMT, up 14 percent from 2017/18 and 7 percent above the 5-year average, if realized. Still, U.S. wheat export sales pace will need to increase to meet this goal, as year-to-date U.S. wheat export sales total just 13.8 MMT or 49 percent of USDA’s anticipated total.

To learn more about 2018 U.S. wheat quality, visit the USW Crop Quality page.

thumbnail

By Ben Conner, USW Vice President of Policy


Longtime readers of “Wheat Letter” know that there is a certain time of year when the “Wheat Letter” must be opened. When its content must be consumed with abandon. When one must read an article so important that – despite all the other wonderful “Wheat Letter” content provided throughout the year – this alone would justify the subscription.


Ladies and gentlemen, that time is now. This is the “Wheat Letter” post you have been waiting for. This is the one where we spin the tale of the “National Trade Estimate” report.


You ask, what is it about the National Trade Estimate that is so important? Why do you spend hours (days!) every year scouring the world to develop one long submission of trade policy issues to present to the U.S. Trade Representative (USTR)?


I am glad you asked. The straightforward answer is that USTR also asked. In 2019, for the 34th time, USTR will release a report on trade barriers around the world. In preparation, the agency published a “Federal Register” notice asking organizations like ours to catalogue all the policy challenges that disrupt U.S. exports.


While we aimed for brevity, globally dispersed conspirators had other plans. Twenty-three pages later and spanning a dozen countries, we have documented some of the most consequential policies affecting U.S. wheat exports today. These are limited to the policies that we believe to be inconsistent with each country’s World Trade Organization obligations and for various reasons the list is not exhaustive. We talk about domestic support, export subsidies, tariff barriers, non-tariff barriers, phytosanitary problems, and more.


Go ahead, take a look. If you love trade policy as much as me, you may still be bored but it could be helpful. After all, the point of listing these trade barriers is eliminating them. Without attention on barriers, governments will never work to solve them. And solving impediments to trade between U.S. farmers and their overseas customers is what we are all about here on the U.S. Wheat Associates trade policy team.

thumbnail

By Stephanie Bryant-Erdmann, USW Market Analyst

USDA updated its monthly World Agricultural Supply and Demand Estimates (WASDE) on Oct. 11, showing the United States to have the largest exportable supply of wheat in the world in 2018/19 following devastating losses in the European Union (EU) and Australia, and decreased production in Russia. Due to the decreasing exportable wheat supplies in these three countries (production plus beginning stocks minus domestic consumption), USDA expects the United States to have the largest exportable supply of wheat in the world in 2018/19 at 50.1 million metric tons (MMT).

Decreased production in half of the major exporting countries — Australia, the EU, Russia and Ukraine —   will result in global wheat production decreasing to 731 MMT, down 4 percent year over year and the lowest level since 2014/15, if realized. While global wheat production will fall for the first time in 5 years, USDA noted that global wheat consumption will reach a new record high of 746 MMT, 4 percent above the 5-year average.

Drought devastated wheat areas in the EU earlier this year and has now spread south to Australia.  USDA expects Australian total wheat production to fall to 18.5 MMT, 13 percent below last year and 26 percent below the 5-year average. Smaller Australian wheat production is also expected to result in 2018/19 Australian wheat exports falling to 13.0 MMT. If realized, that would be the lowest level of Australian exports since 2007/08, 26 percent below the 5-year average.

With Australian wheat exports decreasing sharply year-over-year, USDA expects U.S. white wheat exports to increase 11 percent from 2018/19 to 5.85 MMT, the highest level since 2011/12.

USDA expects 2018/19 U.S. wheat exports to reach 27.9 MMT, up 14 percent from 2017/18 and 7 percent above the 5-year average, if realized. Exports of five of the six U.S. wheat classes are expected to increase year-over-year, and hard red winter (HRW) exports are expected to remain above the 5-year average. Still, U.S. wheat export sales pace will need to increase to meet this goal, as year-to-date U.S. wheat export sales total just 11.6 MMT or 42 percent of USDA’s anticipated total.

thumbnail

By Stephanie Bryant-Erdmann, USW Market Analyst


USDA expects global wheat production to fall to the lowest level in 5 years at 733 million metric tons (MMT), down 3 percent from the record high of 758 MMT in 2017/18. If realized, it would be slightly below the 5-year average. This downturn is, unfortunately, led by decreasing supplies in historic wheat exporters. At the same time, USDA raised its forecast for global wheat consumption to a record high 746 MMT, up 1 percent from 2017/18. To help buyers stay up to date on this fundamental information, U.S. Wheat Associates (USW) is providing this round-up of current conditions and forecasts for Canada, Argentina and Australia.


The estimated wheat production in countries still harvesting adds only a small portion of the 2018/19 supplies in exporting countries, and the total is expected to be down for the second year in a row 


Canada. Winter is here, if you farm in Alberta and Saskatchewan that account for roughly 70 percent of Canadian wheat production. Provincial weekly crop reports on Sept. 11 noted harvest delays from early frosts, wet field conditions and, in some areas, snow. We do not yet know the extent of any damage to wheat quality from these conditions, but it raises concern because more than half of the spring wheat in the two provinces was still in the field. Harvest was an estimated at 23 and 46 percent complete in Alberta and Saskatchewan, respectively.


Agriculture and Agri-Food Canada (AAFC) had already pegged 2018/19 Canadian wheat production (excluding durum) down 4 percent from 2017/18 at 24.0 MMT. A 10 percent decrease in average wheat yields is partially offset by a 7 percent increase in expected harvested area. AAFC reported average wheat yields of 48.3 bu/acre (3.25 MT/ha) compared to 54.0 bu/acre (3.63 MT/ha) in 2017/18. Canadian durum production is expected up 1 percent from 2017/18 to 5.03 MMT; an expected 17 percent increase in harvested area more than offsets a14 percent reduction in average yields year over year. AAFC expects 2018/19 Canadian total wheat exports (including durum) to total 22.2 MMT, up 3 percent from 2017/18.


Argentina. According to the Bolsa de Cereales, the Buenos Aires Grain Exchange, Argentine farmers saw prices staying at profitable levels and planted 7 percent more wheat area for 2018/19. Since planting, the Argentine government announced an export duty of 4 pesos per dollar on wheat exports with its effects to be determined. Bolsa estimated total wheat planted area at 15.1 million acres (6.1 million hectares), up from 14.1 million acres (5.7 million hectares) in 2017/18.


On September 13, Bolsa reported beneficial moisture fell on the La Pampa region and areas around Buenos Aires. However, rainfall has been low in northwestern Argentina, which accounts for roughly one-third of wheat planted area. USDA’s September estimate for 2018/19 Argentinian wheat production was 19.5 MMT (716 million bushels), up 8 percent from 2017/18 and 35 percent greater than the 5-year average. Argentina harvest typically occurs in late November through early January.


Australia. The Australian Bureau of Agricultural and Resource Economics and Sciences (ABARES) forecasts 2018/19 wheat production at 19.1 MMT. That is down 10 percent from 2017/18 due to severe drought in New South Wales and Queensland, where Australian Prime Hard (APH) and Australia Hard (AH) production is centralized. Increased wheat production in Western Australia may partially offset the lower production elsewhere. Still, if realized, production volume would be the lowest since 2007/08. Australian wheat harvest typically occurs in December. USDA expects Australian exports to decrease to 14.0 MMT, 21 percent below the 5-year average.


With global wheat supplies tightening and global demand on the rise, customers should pay close attention to crop conditions in these countries. Even if early snows or drought cut supplies there, or a government intervenes in the market somewhere else, U.S. farmers remain the most reliable suppliers of high quality wheat in the world.