thumbnail

By Claire Hutchins, USW Market Analyst

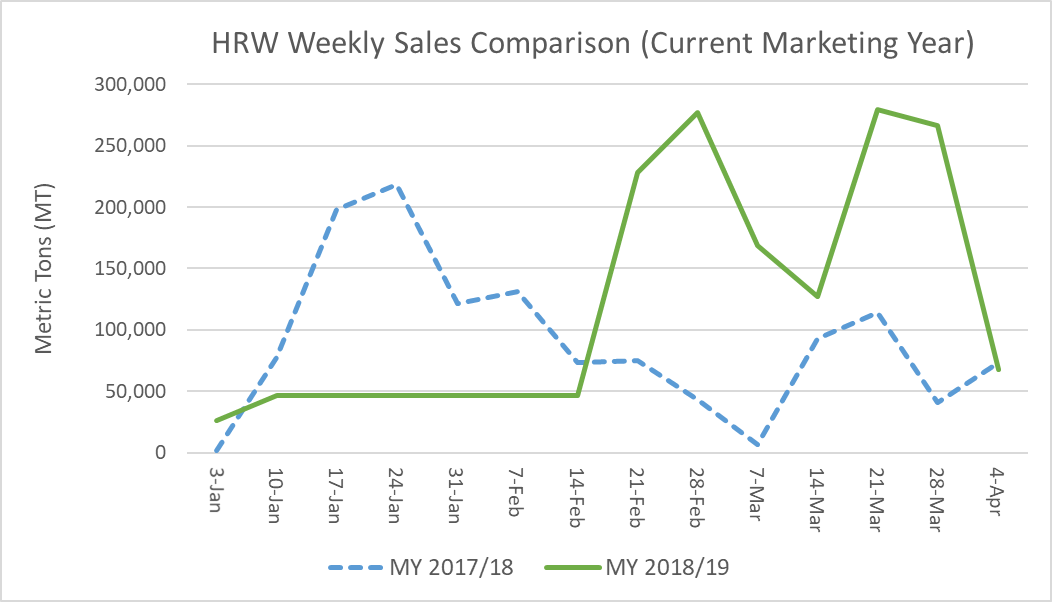
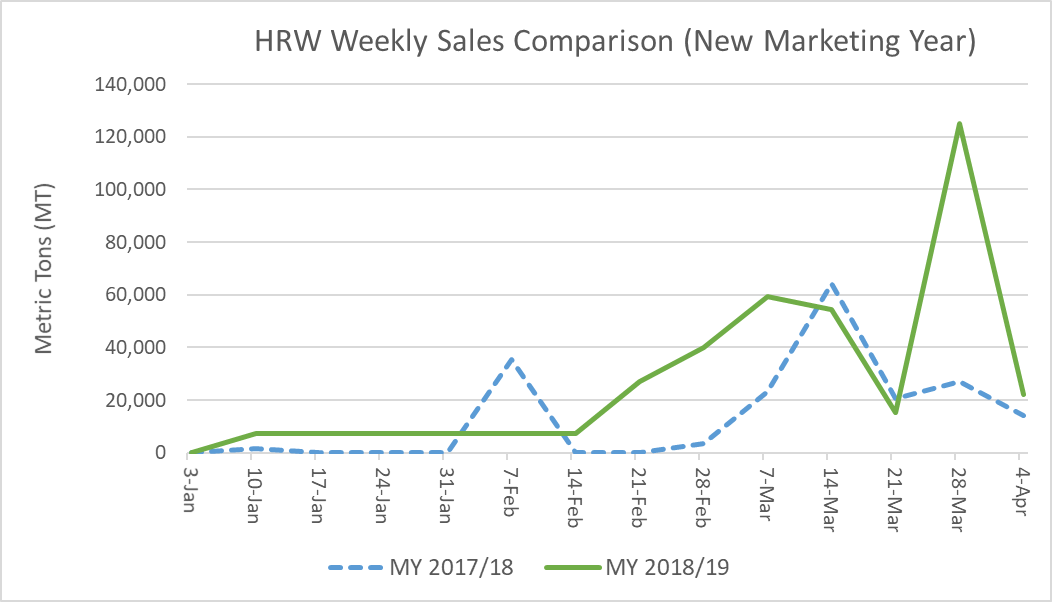
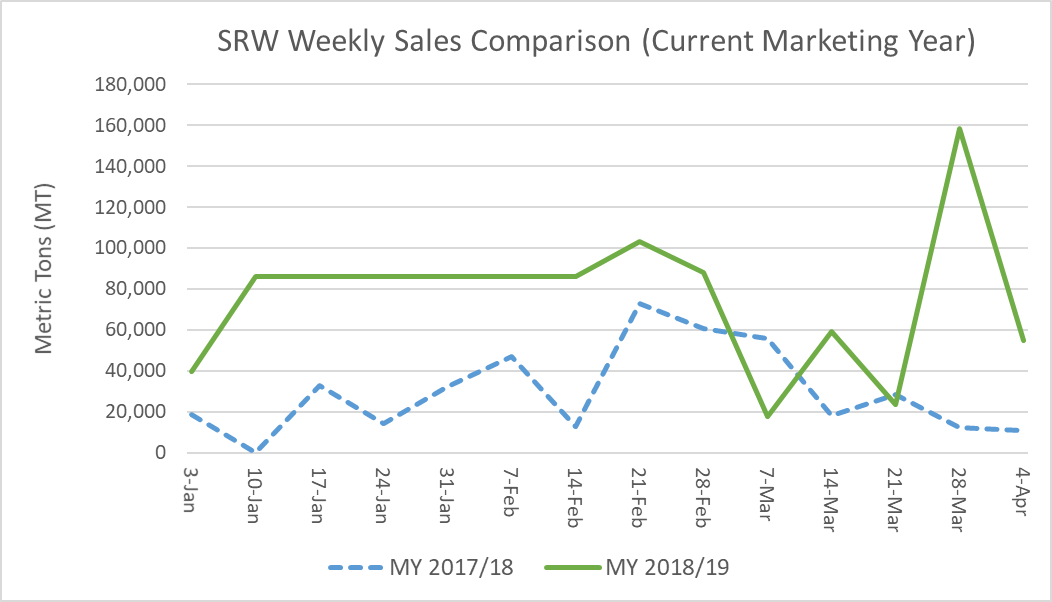
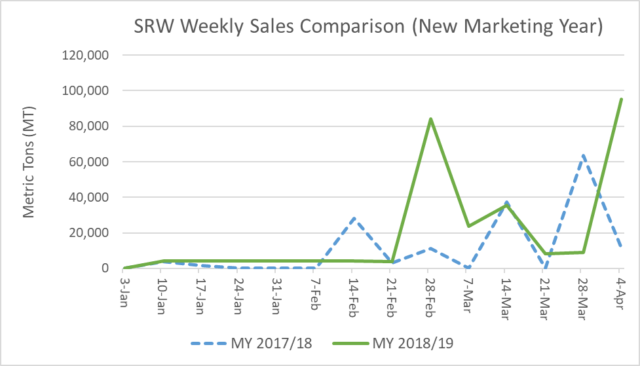
As marketing year (MY) 2018/19 draws to a close, customers of U.S. winter wheat are taking advantage of excellent buying opportunities on competitive pricing and high-quality, consistent supplies. Since the first week in January, the 2018/19 export sales pace for hard red winter (HRW) and soft red winter (SRW) surpassed last year’s pace for deliveries in the current marketing year (CMY) and the new marketing year (NMY).

According to USDA commercial sales data as of April 4, 2019, HRW sales for 2018/19 delivery total 8.70 million metric tons (MMT). That is down 4% from this time last year but up 4% from the 5-year average of 8.33 MMT. Between February 14 and April 4, weekly sales of HRW for CMY delivery were significantly higher than the same six weeks in 2017/18 on low prices and high crop quality attributes. In the April 12 U.S. Wheat Associates (USW) Price Report, estimated FOB export price for 12% protein HRW (12% moisture basis) out of the Gulf at $222/MT for May 2019 delivery compared to $258/MT for delivery in May 2018. HRW export basis for the same delivery month, at $1.70/bu, is significantly lower than last year’s $1.95/bu. In addition to lower FOB export prices, the 2018/19 HRW crop features excellent milling and baking qualities.

These market factors also support a significant uptick in HRW commercial sales into the NMY compared to NMY sales booked by the same time in 2017/18. HRW export sales for the 2019/20 marketing year total 396,000 metric tons (MT), up 64% from this time last year and 17% from the 5-year average. This represents the highest volume of HRW NMY sales to date since 2014/15. The most recent USW Price Report estimates 12% HRW FOB price for June 2019 delivery at $224/MT, compared to last year’s estimate of $259/MT for delivery in June 2018.

Members of the grain trade expect HRW FOB prices and export basis out of the Gulf to decrease steadily into the new marketing year on somewhat larger ending stocks, reduced inland logistical challenges, and favorable new crop conditions.

Turning to SRW, commercial sales to date for 2018/19 delivery total 3.30 MMT, up 36% year-over-year and 10% more than the 5-year average. This represents the highest volume of SRW commercial sales for CMY delivery since 2014/15. Competitive prices, higher than average protein levels and lower than average DON levels continue to elevate SRW export business through the second half of MY 2018/19. More information about the 2018/19 SRW crop is available at https://bit.ly/2ZdnMwi.

The latest USW Price Report valued the SRW export FOB price out of the Gulf at $204/MT for May 2019 delivery compared to $208/MT last year. SRW export basis for May 2019 delivery out of the Gulf at $0.90/bu is 5 cents less than last year’s estimate for May 2018 delivery.

Grain traders expect SRW FOB export prices and export basis to decline steadily into the first few months of MY 2019/20 despite tightening 2018/19 U.S. SRW ending stocks, which are forecast to fall to 4.57 MMT, 18% below 2017/18 and 7% below the 5-year average.

As with HRW sales, total SRW commercial sales for 2019/20 delivery are significantly higher than NMY sales booked this time last year. SRW commercial sales for NMY delivery total 302,000 MT, up 23% year-over-year and 15% from the 5-year average. This represents the highest volume SRW NMY sales to date since 2014/15 as customers look to lock in high quality supplies at globally competitive prices. The April 12 Price Report estimates SRW FOB price out of the Gulf for June 2019 delivery at $202/MT compared to last year’s estimate of $213/MT for the same delivery month in 2018.

 

thumbnail

More than 90 U.S. wheat industry stakeholders will soon get a close-up view of the new wheat crop in Kansas, southern Nebraska, eastern Colorado and northern Oklahoma on the annual Wheat Quality Council (WQC) Hard Winter Wheat Tour April 29 to May 2. This tour and a second one in July focused on U.S. spring wheat are educational for the participants and news worthy as a first snapshot of each year’s new crops.

Tour participants come from as far away as Australia and represent all facets of the wheat industry, including millers, traders, media, farmers, researchers and government officials. By traveling across the region in scout teams that stop at random fields to evaluate crop progress and yield potential, they learn more what it takes for farmers to grow, manage, harvest and market the crop. U.S. Wheat Associates (USW) is sending two colleagues on the tour this year: Director of Programs Erica Oakley and Market Analyst Claire Hutchins.

Domestic and overseas buyers and end-produce processors pay close attention to personal observations and photos during the tour by following #wheattour19 on Twitter and Facebook, through summarized daily reports on Tuesday and Wednesday evenings and in the final report with an estimate of average yield per acre across the region.

The tour provides a statistically significant, early idea of what buyers can expect in new crop yields from the surveyed area. In 2018, for example, 24 WQC scout teams made evaluations at 644 fields and estimated average regional yield at 37 bushels per acre (49.2 kilograms per hectoliter). Official data from USDA’s National Agricultural Statistics Service estimated the average Kansas wheat yield in 2018 at 38 bushels per acre (50.5 kilograms per hectoliter). High Plains Journal posted more about the 2018 Hard Winter Wheat Tour by WQC Executive Vice President Dave Green at https://bit.ly/2XbAmu5.

Watch for observations from Anderson and Hutchins during this year’s tour on USW’s Facebook and Twitter pages and a full report of the 2019 tour May 2 in USW’s Wheat Letter blog.

thumbnail

Last week, an unusual combination of weather conditions created historic flooding in Eastern Nebraska, Western Iowa and parts of Northeast Missouri that literally wiped out many farms and ranches. In Western Nebraska, where most of the winter wheat in the state is grown, farmers suffered through a very bad blizzard at a time when wheat is normally coming out of dormancy.


Nebraska Gov. Pete Ricketts detailed more than $1.3 billion in damage to the state’s infrastructure, agriculture, businesses and homes on March 20. That estimate includes $400 million in projected livestock losses and $440 million in crop losses, including large volumes of stored grain. Tragically, a farmer in Eastern Nebraska, James Wilke, lost his life trying to help others during the flood.


This is happening at a very challenging time for many farmers facing low commodity prices and rising levels of debt.


“There’s not many farms left like this, and it’s probably over for us too, now,” Anthony Ruzicka, a farmer and rancher near Verdigre, Neb., said to the New York Times. “Financially, how do you recover from something like this?”


Royce Schaneman, Executive Director of the Nebraska Wheat Board, told U.S. Wheat Associates (USW) that wheat farmers did not suffer the worst of the storm, although some had livestock losses in the blizzard. Looking ahead, the long-lasting winter of 2019 increases the chance of flooding along the Red River that borders Minnesota and North Dakota and flows into Canada’s Manitoba province — and that is spring wheat country.


The federal government is developing a response to last week’s disaster. USDA Secretary Sonny Perdue sent this Tweet recently: “We are on the job helping folks in the Midwest get back on their feet and recover from these devastating floods. Farmers can expect assistance from a variety of programs we offer in the wake of disasters. More here: https://www.farmers.gov/recover.”


Other ways to help those affected by the storm include the Nebraska Farm Bureau’s Disaster Assistance Exchange that accepts donations and helps match donors with those in need.


Farmers and ranchers gladly accept the inherent risk of their work and suffer with those who experience these storms. Everyone else, including our colleagues from USW and the National Association of Wheat Growers, and our customers around the world cannot forget how much we all depend on the people who produce our food.


thumbnail

By Erica Oakley, USW Director of Programs

As a key part of its commitment to transparency, each year U.S. Wheat Associates (USW) produces an annual Crop Quality Report that includes grade, flour and baking data for all six U.S. wheat classes. The report is compiled from sample testing and analysis conducted during and after harvest by our partner laboratories. The report provides essential, objective information to help buyers get the wheat they need at the best value possible.

The 2018 USW Crop Quality Report is now available for download in English, Spanish, French and Italian, and will be available in Chinese and Arabic soon. USW also shares more detailed, regional reports for all six U.S. wheat classes on its website, as well as additional information on its sample and collection methods, solvent retention capacity (SRC) recommendations, standard deviation tables and more.

USW’s annual Crop Quality Seminars are already underway and will continue over the next month around the world. USW invites its overseas customers, including buyers, millers and processors, to these seminars led by USW staff, U.S. wheat farmers, state wheat commission staff and educational partner organizations. The seminars dive into grade factors, protein levels, flour extraction rates, dough stability, baking loaf volume, noodle color and texture and more for all six U.S. wheat classes, and are tailored to focus on the needs and trends in each regional market.

In 2018, USW is projected to host 41 seminars in 28 countries.

Customers have previously shared that they use the report throughout the year as a reference manual and to guide them through purchases and future planning. The seminars provide a first look at the overall crop and a deep dive into the data and how to use it. Customers will often use the seminars and report as educational training for new employees.

The reports and seminars have been a traditional part of USW’s strategy since 1959, growing to become its single largest marketing activity.

thumbnail

By Stephanie Bryant-Erdmann, USW Market Analyst

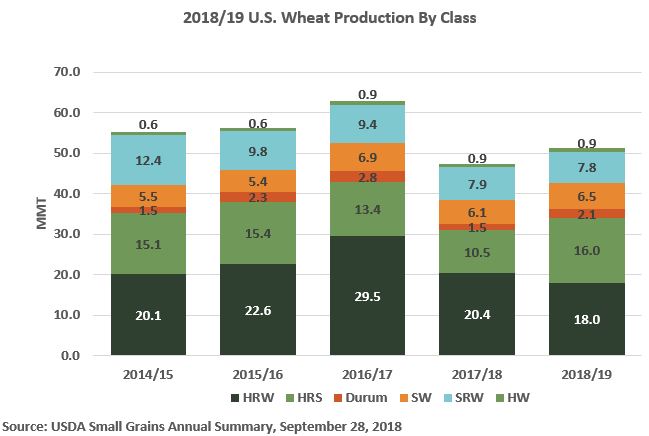
On Sept. 28, USDA released its Small Grains Summary noting that 2018/19 U.S. wheat production increased to 51.3 MMT, up 8 percent from last year due to improvements in both average yield and harvested area. While this is still 8 percent below the 5-year average of 55.8 MMT, the 2018/19 production coupled with significant carry-in stocks ensure that the U.S. wheat store will remain open and well-stocked throughout 2018/19. Here is a look at 2018/19 U.S. wheat production by class.

Hard red winter (HRW). Last fall, U.S. farmers increased HRW planting in the U.S. Southern Plains due to favorable moisture conditions. That slight increase was not enough to offset decreased planted area in the U.S. Northern Plains where a long-term drought delayed, and in some cases, prevented winter wheat planting. Planted area in Montana fell 6 percent year over year. USDA reported HRW planted area at 23.2 million acres (9.39 million hectares), down 2 percent from 2017. Unfortunately, most of the Southern Plains received little to no moisture until spring, with some areas going from October to April without measurable precipitation. The poor weather caused Oklahoma wheat farmers to abandon 43 percent of their winter wheat area, up from both the 5-year average and the 2017/18 abandonment rate of 36 percent. The average HRW yield in Kansas and Oklahoma, the top two HRW-producing states, decreased 21 percent and 18 percent from 2017/18, respectively. With the drought causing both harvested area and average yields to fall, USDA estimates total 2018/19 HRW production dropped 12 percent to 662 million bushels (18.0 MMT). Though smaller in volume, 2018 HRW quality i is excellent. Read more here.

Hard red spring (HRS). Wet conditions slowed HRS planting but replenished depleted soil moisture across the drought stressed Northern Plains. USDA says U.S. farmers planted 12.1 million acres (4.90 million hectares) to HRS, up 17 percent from the year prior. The beneficial moisture boosting average HRS yields and harvested area. In North Dakota, the top HRS producing state, the average yield climbed 20 percent year over year to a record high 49.0 bu/acre (3.29 MT per hectare), up 41 percent from 2017/18. Idaho farmers also produced record high HRS yields. USDA now reports HRS production at 587 million bushels (16.0 MMT), up 53 percent from 2017/18.

Soft red winter (SRW). Last fall, U.S. farmers planted 5.85 million acres (2.37 million hectares) of SRW, up 4 percent from the year prior, but still 23 percent below the 5-year average. While planting conditions were generally favorable, depressed prices kept planted area low. In early 2018, several U.S. SRW growing areas received excessive moisture that decreased yield potential and the wet weather continued through harvest. USDA reported SRW production totaled 286 million bushels (7.78 MMT), down 2 percent from 2017/18 and 33 percent below the 5-year average of 429 million bushels (11.7 MMT). Read more here.

White wheat (including soft white, club and hard white). U.S. white wheat planted acres stayed close to the 5-year average at 4.15 million acres (1.68 million hectares) in 2018/19. A wet winter boosted yield potential for both the winter and spring crops. The average spring white wheat yield in Washington increased 20 percent to 54.0 bu/acre (3.63 MT per hectare). The slight increase in harvested area and significant improvement in average yields pushed 2018/19 total white wheat production to 272 million bushels (7.41 MMT), a 5 percent increase year over year, and 8 percent above the 5-year average of 252 million bushels (6.86 MMT).

Durum. Farmers planted less durum area this year in response to lower prices and large carry-out stocks during spring planting. USDA estimates 2.00 million acres (810,000 hectares) were planted to durum, down 13 percent from 2017/18 but still 9 percent above the 5-year average of 1.84 million acres (745,000 hectares). USDA estimated total 2018/19 U.S. durum production at 77.3 million bushels (2.10 MMT), up 41 percent from last year. Generally favorable weather boosted yields in the U.S. Northern Plains, with average durum yields increasing to 39.3 bu/acre (2.64 MT per hectare), up 13.3 bu/acre from last year when drought severely impacted the crop. Desert Durum® production fell 8 percent year over year to 10.5 million bushels (385,000 MT) due to sharply lower planted area in both Arizona and California.

Wheat food products to illustrate Wheat Industry News

The conscientious husbandry of U.S. farmers and the distinct influence of growing conditions across the Plains and into the Pacific Northwest helped produce a 2018 U.S. hard red winter (HRW) crop that has above average kernel characteristics and, in most cases, higher protein than the previous two crops. Annual crop quality testing sponsored by U.S. Wheat Associates (USW) and its partners from Plains Grains and USDA indicates the 2018 HRW quality attributes significantly exceed the last two years and many of the 5-year averages.

Most people and organizations in the industry consider this one of the highest quality crops in several years and will make high quality end products. This crop meets or exceeds typical HRW contract specifications and should provide high value to our customers.

Here is a summary of the season and test results, with full data soon available online and in USW’s annual Crop Quality Seminars.

Weather and Harvest

The 2018 hard red winter (HRW) planted area was 2.5 percent below the historical low planted area of the 2017 crop. With reduced yields and reduced area, 2018 HRW production is estimated to be 18.0 million metric tons [(MMT) (662 mil bu)], down 12 percent from 2017’s 20.4 MMT and 20 percent below the 5-year average production. Large beginning stocks offset the reduced production so the total HRW supply available for the 2018/19 marketing year is larger than three of the previous 5 years.

Conditions varied across the HRW growing regions. Texas, Oklahoma and Kansas were extremely dry during most of the growing season. By the time harvest started in early June, USDA rated 85 percent of HRW in these three states to be in fair, poor or very poor condition. Late season precipitation helped to establish good kernel characteristics even though rains were too late and insufficient to improve yield. In contrast, 75 percent to 90 percent of the crop rated fair, good or excellent in the remaining states north to eastern Montana. Because of dry conditions, disease and insect pressure was low.

Washington, Oregon, Idaho and central/north central Montana had adequate moisture throughout the year that helped maximize production. More than 90 percent of the HRW grown in these three states was rated fair, good or excellent in late June.

Wheat and Grade Data

Despite challenging growing conditions in many areas, the 2018 crop has generally good kernel characteristics. Overall 93 percent of Composite, 91 percent of Gulf-Tributary and 98 percent of PNW-Tributary samples graded U.S. No. 2 or better. Test weight averages 60.9 lb/bu (80.2 kg/hl), above the 5-year average of 60.3 lb/bu (79.3 kg/hl) and above last year’s average of 60.5 lb/bu (79.6 lb/bu). The total defects average of 1.4 percent is above last year’s average of 1.2 percent, but below the 5-year average of 1.6 percent. Foreign material is 0.2 percent, slightly above last year’s 0.1 percent, while shrunken and broken at 1.1 percent is above last year’s 0.9 percent and equal to the 5-year average. Average thousand kernel weight of 30.9 g exceeds the 5-year average of 29.8 g. The average wheat falling number is 373 seconds, which is comparable to the 2017 and 5-year averages and indicates sound wheat.

The average protein of 12.4 percent (12 percent moisture basis or mb) is significantly higher than last year and equal to the 5-year average. Protein content distribution varies by growing region; the Gulf-Tributary average is 12.7 percent and the PNW-Tributary average is 11.7 percent. Approximately 12 percent of the samples tested were less than 11.5 percent protein, 29 percent between 11.5 percent to 12.5 percent and 60 percent greater than 12.5 percent.

Flour and Baking Data

The Buhler laboratory flour yield average is 75.1 percent, lower than the 2017 average of 78.1 percent and similar to the 5-year average of 75.7 percent. The 2018 flour ash of 0.44 percent (14 percent mb) is significantly lower than last year’s 0.64 percent and the 5-year average of 0.59 percent. Composite sedimentation and wet gluten values, 54.2 cc and 28.1 percent, respectively, are both higher than last year. The W value of 280 (10-4 J) is significantly higher than last year’s average of 199 (10-4 J) and the 5-year average of 228 (10-4 J). average bake absorption is 63.7 percent, above the 62.8 percent value for both 2017 and the 5-year average. Farinograph peak and stability times, 5.2 min and 12.2 min, respectively, are higher than last year’s 4.5 min and 6.1 min. Loaf volume averages 901 cc, above the 2017 and 5-year averages.

thumbnail

U.S. farmers are making good progress now on the second half of their 2018 winter wheat harvests and U.S. Wheat Associates (USW) wants to provide a mid-season look at winter wheat harvest and quality in this “Wheat Letter” entry. USW publishes a new Harvest Report every Friday on this website.


Soft Red Winter (SRW) harvest of a crop that was quite affected by rain throughout the growing season is now complete. Planted area was up somewhat compared to last year’s record low level. With abundant rain, yields were above average for the year but test weights from crops in both the East Coast and Gulf port tributaries are less than last year and the 5-year average. That knocks down the U.S. Grade for this crop to #3 SRW. DON levels are slightly higher in 2018 but are below the 5-year average. Processers should find good qualities for crackers overall and for cookies from segments of the crop. With higher protein and good extensibility, the crop should also be valuable for blending for baking applications. USW will post the final SRW quality report within the next few weeks.

John Hoffman SRW Wheat

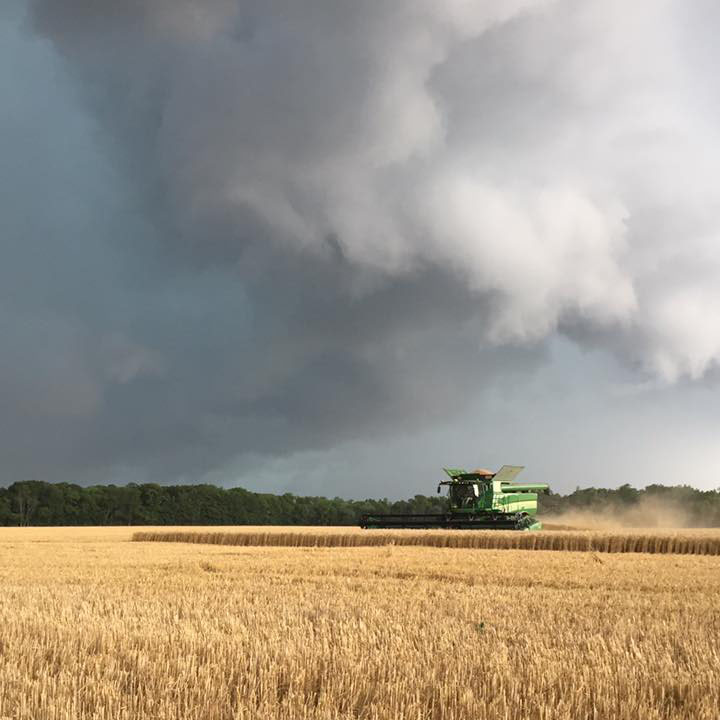
Past USW Director John Hoffman of Circleville, Ohio, just beat the rain to complete his 2018 SRW harvest.


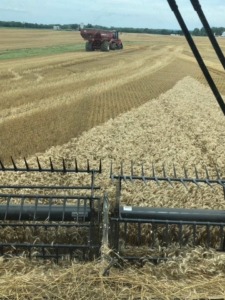
Hard Red Winter (HRW) harvest is more than 80 percent complete and buyers should want to take a very good look at the 2018 crop. Starting with another record low planted area, USDA believes farmers will harvest 17.9 million metric tons (MMT) of HRW this year or 12 percent less than in 2017. That amount is likely to change as USDA measures the effects of abandoned area in drought stressed areas of the Southern Plains. For buyers, however, this is a very good supply of HRW with composite protein holding at 12.6% (12% moisture) and test weights at 79.7 kg/hl (60.6 lb/bu). Quality reports from Montana’s harvest are even better. While flour and dough properties are just being measured for this crop, domestic millers and processors are saying they like what they see in this HRW crop.

HRW Harvest Peter Miller

HRW farmer Peter Miller of Lodgepole, Nebraska, posted this photo on his Twitter account @pmiller1320 on July 23.


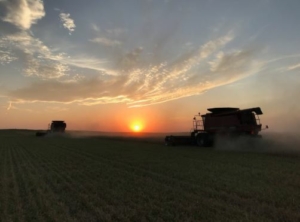
Soft White (SW) winter wheat growing conditions across the Pacific Northwest (PNW) were nearly ideal for the 2018 crop. As of Aug. 3, the PNW SW harvest was 55% complete in Oregon (sadly aided by destructive fires in the north-central part of the state), 28% in Washington and 12% in Idaho. Industry sources say continued dry weather has pushed progress beyond those levels since early this week. Dryland yields are well above normal and early quality analysis indicate good test weight at 61.8 lb/bu (81.3 kg/hl), very low moisture content at 8.4%, low protein at 9.4% (12% moisture basis), and sound falling number value at 305 seconds.

Harvest Time Logan Padget

Logan Padget, son of USW Secretary-Treasurer Darren Padget, of Grass Valley, Oregon, posted this beautiful image of SW “Harvest Time” on their farm July 23.


We hope you will subscribe to USW’s Harvest Report and if you want to ask questions about this year’s crops or about other topics related to U.S. wheat and U.S. wheat exports, visit our new “Ask the Expert” section of this website at https://www.uswheat.org/market-and-crop-information/ask-the-expert/.


thumbnail

By Stephanie Bryant-Erdmann, USW Market Analyst


There is an old saying: “When there’s blood on the streets, buy property.” Given recent price movements, that could easily be changed to: “When trade policies are in the news, buy wheat.”


Since the steel and aluminum tariffs went into full effect for major U.S. wheat customers, September Kansas City hard red winter (HRW) wheat futures have fallen 51 cents per bushel ($19 per metric ton [MT]), September Chicago soft red winter (SRW) wheat futures dropped 25 cents per bushel ($9 per MT) and Minneapolis hard red spring (HRS) plunged 58 cents per bushel ($21 per MT).


Seasonal harvest pressure always impacts U.S. wheat prices during the summer months; however, this year the unique trade environment is also pressuring export demand and driving U.S. wheat prices lower. As of July 19, U.S. export sales for marketing year 2018/19 (June 1 to May 31) totaled 6.43 MMT, down 32 percent year over year. Exporters note that customers are choosing to purchase smaller than normal volumes of U.S. wheat, just what they need for the short-term or are waiting to make purchases, noting uncertainty about U.S. trade policies and their own countries’ retaliatory measures. Sales to the top five U.S. wheat customers — Mexico, Japan, the Philippines, Korea and Nigeria — are 27 percent behind last year’s pace.


Futures v Global S&D

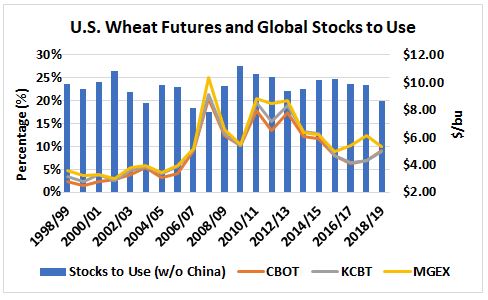
U.S. wheat futures prices are not reflecting global supply and demand realities. Buyers are uncertain about the effects of unforeseen tariff wars and have altered their typical wheat import cadences.

With trade policy issues dominating the headlines, U.S. wheat futures markets are mostly ignoring global wheat supply and demand fundamentals, which can be seen in competitors’ wheat prices. The average global wheat price is up 41 cents per bushel ($15 per MT) with larger increases noted in Australia and Argentina, which compete with the United States in key quality-driven markets. According to International Grains Council (IGC) data, the average price of Australian wheat is up $19 per MT and the average price of Argentine wheat is up $75 per MT. These price increases are driven by increased global wheat demand, shrinking global wheat supplies and their location.


USDA noted in last week’s World Agricultural Supply and Demand estimates that global wheat production will fall to 737 MMT in 2018/19, the first drop in 5 years and down 3 percent from 2017/18. Decreased production is expected in the European Union (EU), Russia, Ukraine, Kazakhstan, and Australia. While the United States, Canada and Argentina are expected to have increased production, exporter supplies are expected to fall 20.2 MMT year over year.


Simultaneously, many importers are engaging in “just in time” purchases since wheat price movement has rewarded their patience the last few years. USDA expects importer ending stocks to fall to 49.8 MMT in 2018/19, the lowest amount in a decade.


While importer stocks are shrinking, USDA expects global wheat demand to surge to a new record high of 749 MMT, 4 percent above the 5-year average. That means that global wheat consumption will outpace global wheat production by 12.6 MMT this year and drop the global wheat stocks-to-use ratio (excluding China) to less than 20 percent. A level that has not been seen since 2007/08.


For perspective, in July 2007 all three wheat futures were above $6.00 per bushel ($220 per MT) and would continue climbing until March 2008 when prices peaked at $11.60 per bushel ($426 per MT) for SRW, $12.17 per bushel ($447 per MT) for HRW and $17.30 per bushel ($636 per MT) for HRS. On Friday, July 20, those three futures were at $5.16 per bushel ($190 per MT), $5.08 per bushel ($187 per MT) and $5.55 per bushel ($204 per MT), respectively, indicating there is a lot of room for upward mobility.


With exporter supplies shrinking and importers continuing a “just in time” purchasing pattern, global wheat prices are sitting on a powder keg that trade policy issues are currently disguising. Customers should take advantage of current U.S. futures price levels and lock in the competitive prices.


To track U.S. wheat export prices, subscribe to the USW Weekly Price Report.

U.S. Wheat Associates Board of Directors Header

Generally cool spring conditions delayed the start of the 2018/19 U.S. winter wheat harvest, but the combines are now in the fields and U.S. Wheat Associates (USW) published a preliminary Harvest Report on May 25. USW Harvest Reports are published every Friday afternoon, Eastern Daylight Time, throughout the season with updates and comments on harvest progress, crop conditions and current crop quality for hard red winter (HRW), soft red winter (SRW), hard red spring (HRS), soft white (SW) and durum wheat.

The weekly Harvest Report is a key component of USW’s international technical and marketing programs. It is a resource that helps customers understand how the crop situation may affect basis values and export prices.

USW’s 14 overseas offices share the report with their market contacts and use it as a key resource for answering inquiries and meeting with customers. USW also publishes the report in Spanish as  “Trigonoticias,” distributed to Latin American wheat buyers and millers and posted on www.uswheat.org.

Anyone may register to subscribe to an email version of the Harvest Report. For the first time this year, USW includes links in the email to additional wheat condition and grading information, including the U.S. Drought Monitor, USDA/NASS Crop Progress and National Wheat Statistics, the official FGIS wheat grade standards and USDA’s World Agricultural Supply and Demand Estimates report. Harvest Reports are also posted online at www.uswheat.org/harvest.

thumbnail

By Stephanie Bryant-Erdmann, USW Market Analyst

Since the beginning of the calendar year, export cash prices for hard red winter (HRW) wheat prices have rallied an average 73 cents at the Gulf across all protein levels. However, export cash prices are made up of two components — wheat futures and export basis. Most of the export price rally matches the futures market, which climbed from $4.37 per bushel in January to $5.64 per bushel on May 25. However, U.S. Wheat Associates (USW) and the farmers it represents also face historically high rail rates that support the export basis.

The futures rally is based on two fundamental factors — drought in the U.S. HRW-growing area, which is shrinking the U.S. HRW supply, and concern about poor crop conditions around the world, which the market believes is increasing potential demand for U.S. HRW.

On May 10, USDA forecast global world wheat consumption to outpace global wheat production in 2018/19 for the first time since 2012/13 due to reduced production in Russia, Ukraine and Kazakhstan. The growing demand for wheat around the world and the expectation of smaller Black Sea supplies are pushing up U.S. export prices.

As of May 31, the U.S. Drought Monitor reported that the Oklahoma and Texas panhandles and 75 percent of Kansas are still in a moderate to exceptional drought. The corresponding wheat condition ratings reflect the effects: USDA rated 48 percent, 63 percent, and 54 percent of HRW in poor or very poor condition, respectively, in the region.

The market also expects the drought to help increase new crop HRW protein levels (although the data to support that expectation is not yet available). This has caused protein premiums and discounts to erode. In the Gulf, the protein premium for 12.0 percent protein (12 percent moisture basis) HRW over 11.5 percent protein (12 percent moisture basis) fell from an average $23 per MT ($0.64 per bushel) in January to $8 per MT ($0.21 cents per bushel) year to date in May (See “HRW Export Basis and Rail Rates”). Similarly, the average protein premium for 11.5 percent protein over 11.0 percent protein (12 percent moisture basis) fell an average ($0.35 per bushel) during the same time frame.

The declining protein premiums for HRW partially offset the futures rally, and export cash prices for 12.0 percent protein and 11.5 percent protein (12 percent moisture basis) HRW in the Gulf remain below the respective 5-year averages.

However, while the weather fundamentals are dominating the news, there is also a third factor that is quietly playing a role in U.S. export prices — increased U.S. rail rates. According to USDA/Agricultural Marketing Service Grain Transportation Report data, year-to-date in 2018, the average cost of railcar transportation for wheat from Kansas to the Gulf is $45 per MT ($1.21 per bushel). That is the highest level since USDA began tracking rail rates in 2010. Rail rates for wheat will increase to a new record high this summer according to notices that went out to customers in March and April.

Rail rates are a key component of export basis, which also includes elevation, barge freight and labor costs. Yet the cost of transporting wheat is shared by the farmer and the overseas customer through country elevator basis levels and export basis levels. Consequently, higher rail rates act as both a ceiling for farm gate prices and simultaneously as a floor for export prices.

On the export basis side, this can most easily be seen in the export basis levels for ordinary or unspecified protein wheat. Year-to-date in 2018, ordinary protein HRW export basis has averaged $42 per MT ($1.15 per bushel), compared to $27 per MT ($0.74 per bushel) in 2017, when the average rail rate from Kansas to the Gulf (See “HRW Export Basis and Rail Rates”) was $43 per MT ($1.18 per bushel).

As customers ride out the market volatility that always occurs this time of year, they should keep in mind that U.S. export basis levels are supported by increased transportation costs, and the 2018/19 global stocks to use ratio without China is forecast at a tight 20 percent as noted in the USW May 17 Wheat Letter article “Chinese Wheat Stocks Mask Tight Stocks to Use Ratio.”